


Healthcare data visualization plays a crucial role in saving lives.
Big data is disrupting the health care industry. It’s no surprise that the healthcare analytics market is expected to reach USD 40.781 Billion by 2025.
Healthcare data visualization makes sense of large volumes of data, enabling health professionals to inch closer to their goal of saving lives.
Venngage data visualization templates can help stakeholders tell a story with data. This visual representation of data is beneficial for evidence-driven clinical decisions.
In this article, we will look at how data visualization is used in healthcare. We will also give you some professionally designed templates that you can use, along with Venngage’s Infographic Maker to start visualizing your healthcare data.
Click to jump ahead:
- The explosion of healthcare data
- What is data visualization?
- How is data visualization used in healthcare?
- How can data visualization improve healthcare decision-making?
- Qualities of good health data visualization
- Examples of data visualization in healthcare
- Healthcare data visualization FAQ
The explosion of healthcare data
An electronic health record (EHR) is like a bagless vacuum cleaner for health data. It sucks up every bit of data, from a patient’s medical history to diagnoses and laboratory test results.
And it doesn’t end there. Patient data is also constantly extracted from health surveys, claims, and vital records.
Disease registries also track patient data round-the-clock. Not to forget the physiological data collected from clinical trials and wearable devices.
You can find data anywhere. But having access to this data is not enough to save lives. To make critical life-changing decisions, you need to first visualize your data in a way that helps you connect the dots.

What is data visualization?
Data visualization, also known as DataViz, is the representation of complex data in a graphical format.
The goal of data visualization is for the user to see and understand complex statistics in a digestible format.
Data visualization goes hand-in-hand with data analytics. The former involves visual interpretation, and the latter analysis (processing).
Below is an example of how data visualization is used to describe a caffeine addiction weaning progress:

How is data visualization used in healthcare?
Today, more health data is collected digitally and stored in EHRs than was collected decades ago.
Data visualization has so many applications in healthcare. These include:
- Predicting a patient’s health status
- Understanding health-related quantitative data
- Understanding health-related qualitative data
1. Predicting a patient’s health status
With the growing popularity of fitness apps, wearable devices, biosensors, and other clinical devices that can track patients’ real-time physiological data, physicians can save more lives than ever before.
When physicians collect this data and integrate them into patients’ EHRs, they can predict a patient’s health status.
For example, visualizing a patient’s heart rate over time can reveal heart abnormalities. A medical disaster can be caught before it ever happens.
In the data visualization below, heart rate and sleep are recorded in the days preceding, during, and after a Ph.D. defense.

2. Understanding health-related quantitative data using data visualization
Quantitative data is measurable. American author Gregg Easterbrook wrote, “Torture numbers, and they’ll confess to anything.”
Numbers don’t lie! Quantitative data is all about numbers. Examples of quantitative data that can be pulled up from EHRs include:
- the number of individuals participating in a clinical study
- their behaviors (for example, average number of minutes to complete a physical activity)
- health outcomes (for example, basal metabolic index (BMI), weight, and waist circumference)
- hospitalization rates
Approximately four out of five (96%) non-federal acute care hospitals in the US have a basic EHR system. Also, 85.9% of office-based physicians use any type of electronic medical record (EMR) or EHR system. It’s amazing that at the click of a button and at any time, clinicians can pull up patients’ medical information.
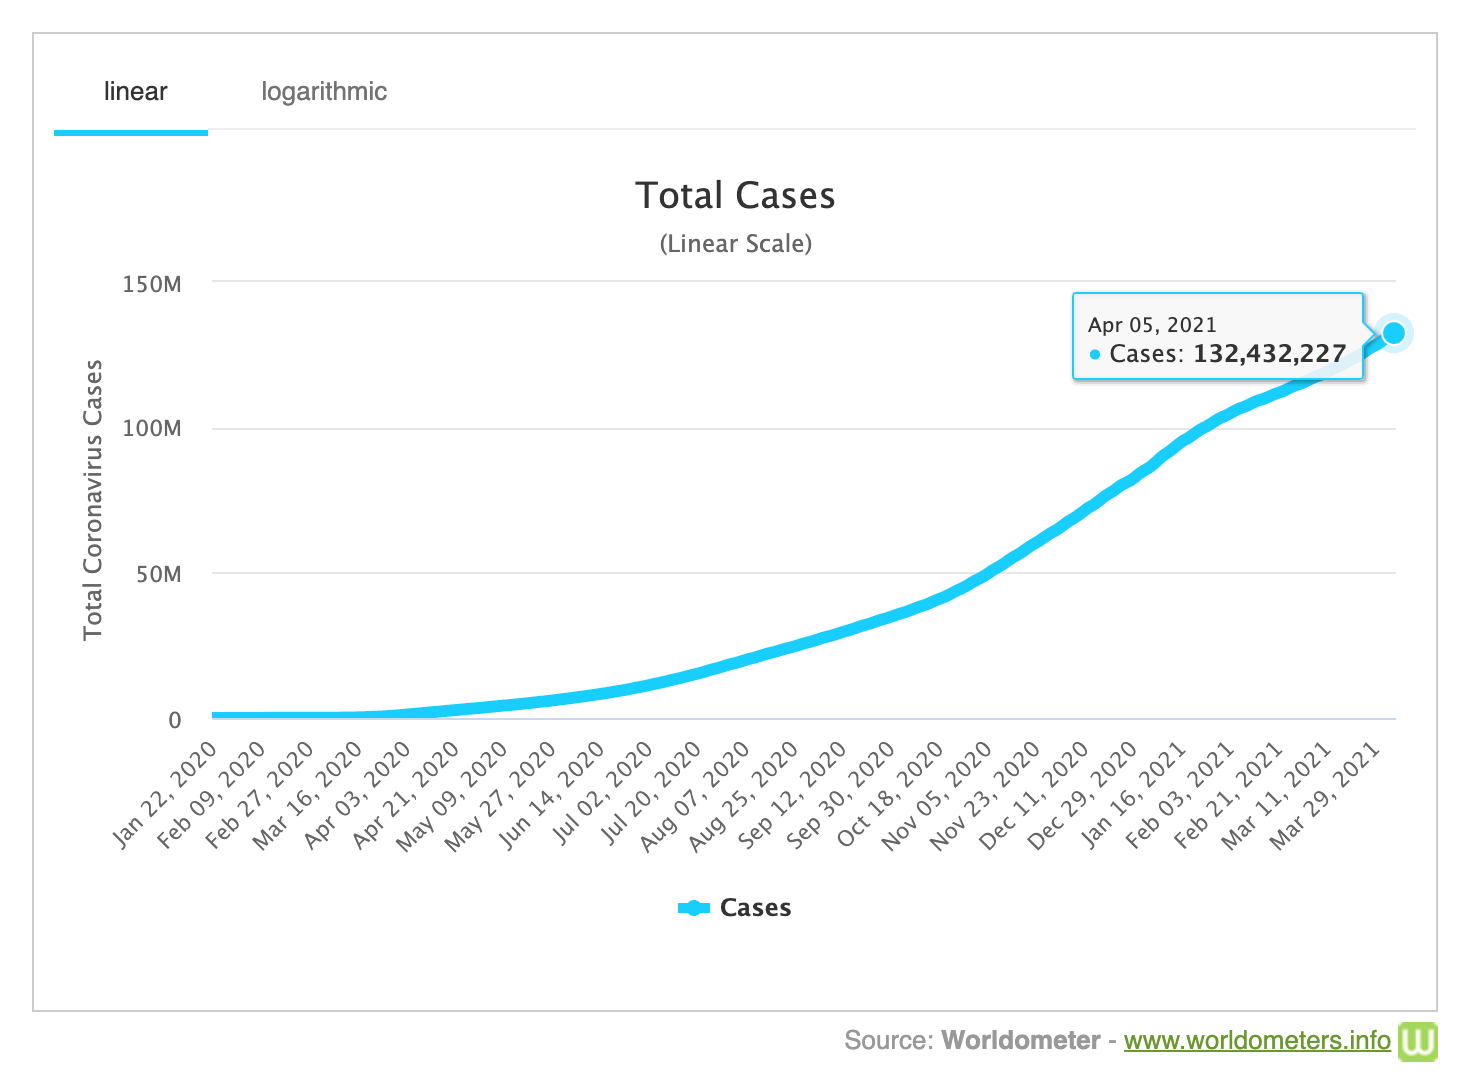
In this example below, the US Centers for Diseases and Control (CDC) visualizes quantitative data by graphing weekly COVID-19-associated hospitalization rates between March and November 2020.

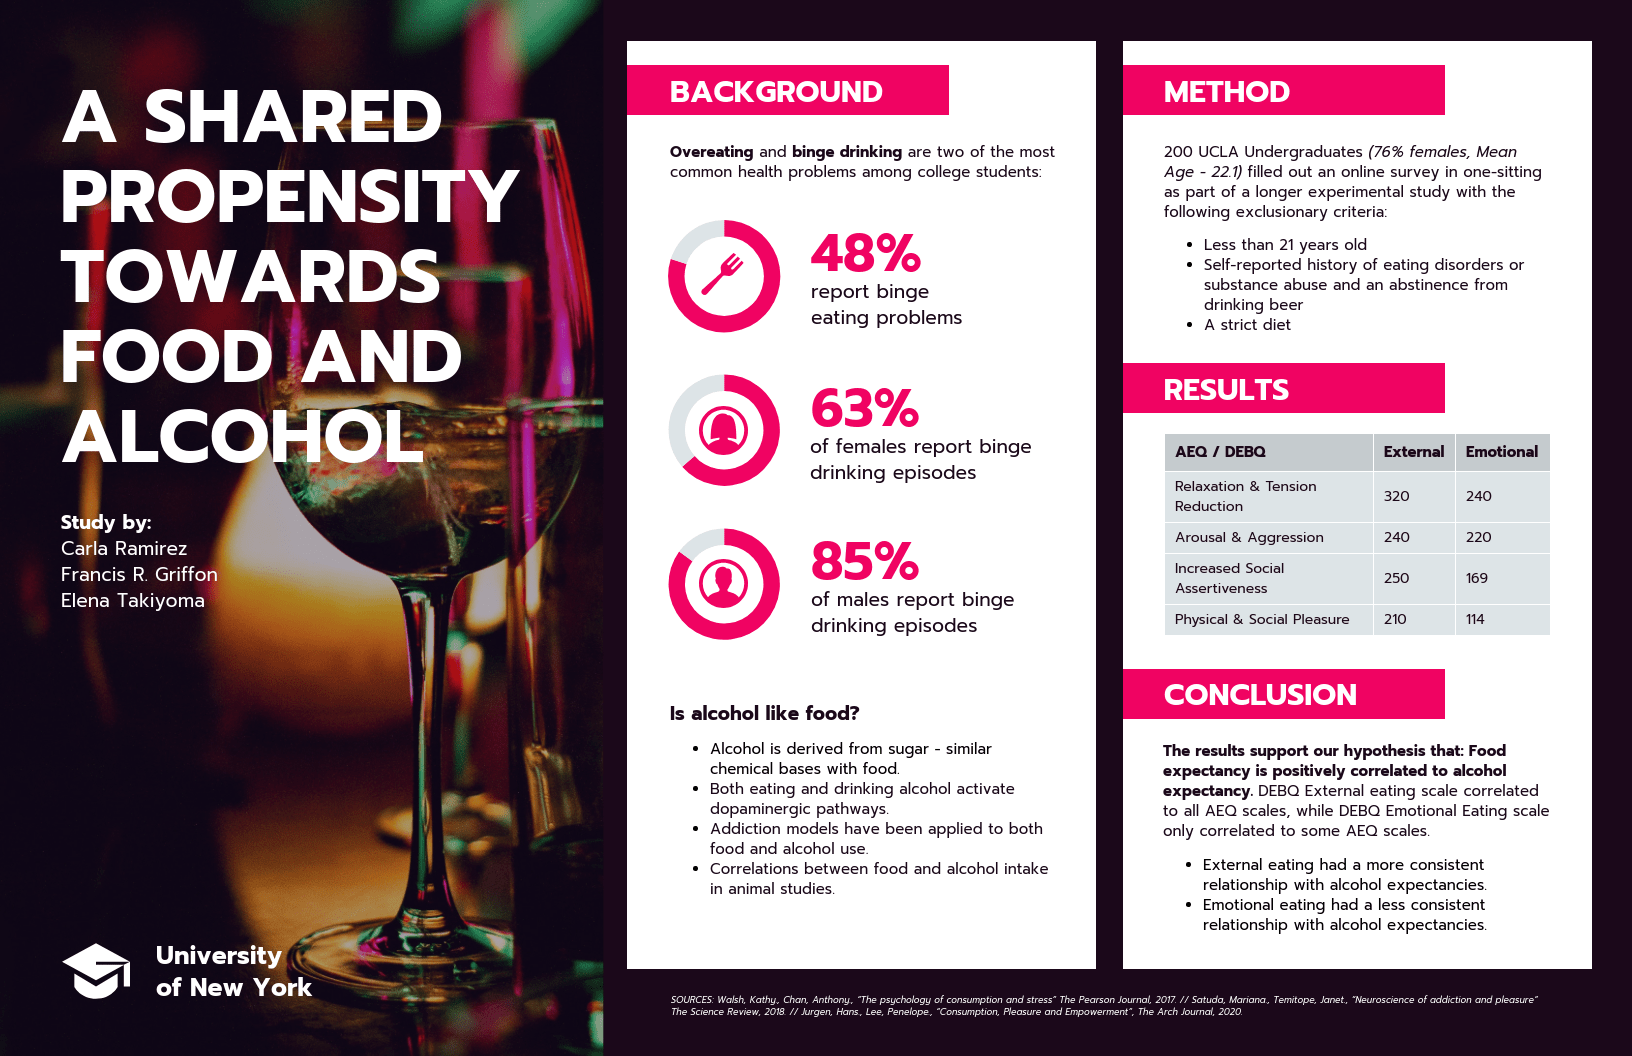
Here is another data visualization example of how healthcare quantitative data can be illustrated using infographics so it’s easier to scan and understand:

3. Understanding health-related qualitative data using data visualization
Qualitative data is non-numeric information. It is also sometimes referred to as unstructured data. A big reason for visualizing qualitative data is to understand the connections and patterns between certain keywords.
Data visualization portrays qualitative data using methods like text analysis (word clouds), timelines, and illustrative diagrams.
According to Adam Long, chief technology and innovation officer of Unico:
Qualitative researchers use visualizations to explore or gain insights into their data as follows: 62% Coding Stripes, 41% Word Trees, 37% Word Clouds, 36% Charts, 27% Concept Maps, 26% Explore Diagrams, 25% Mind Maps, 22% Comparison Diagrams, 21% Hierarchical Charts, 15% Project Maps, 12% Sociograms, and 10% Geovisualizations.
An example of how qualitative researchers visualize data can be seen below:

This is another example of how healthcare qualitative data can be visualized using infographics. Note that the use of colors and actual photos point out the differences among different types of contraceptive methods and also make it easier for people to understand:

How can data visualization improve healthcare decision-making?
Data visualization helps healthcare stakeholders track their progress as they work toward medical interventions. Critical decision-making relies on data that can be visualized and processed.
Data visualization influences healthcare decisions, such as:
- Improving or accelerating hospital performance
- Choosing appropriate health interventions
- Enforcing public health mandates
1. Data visualization improves or accelerates hospital performance
In any type of business, you want to measure your success using numbers.
Data visualization helps hospital administrators make decisions that improve or accelerate hospital performance.
Examples of relevant data include patient wait time, admission rates, treatment costs, and types of medical conditions, just like the example below.

2. Data visualization helps specialists choose appropriate health interventions
Over half a million deaths from COVID-19 have occurred in the United States, according to Johns Hopkins University Coronavirus Center.
So far, scientists have used various data visualization tools to track the numbers of cases and deaths.
The visualization and analysis of this data increased the urgency of the research that went into the US Food and Drug Administration’s (FDA’s) authorization of the Pfizer-BioNTech, Moderna, and Johnson and Johnson/Janssen vaccines for COVID-19.
Here is an example of a data visualization scatterplot of confirmed cases and deaths from COVID-19.

You can create a similar scatterplot healthcare data visualization using Venngage Infographic Maker and the template below:

3. Data visualization prompts public health officials to enforce public health mandates
Public health data visualization informs public health officials. A quality data visualization helps them decide when to enforce health mandates.
Public health officials have enforced mask-wearing mandates based on data visualization dashboards. For example, 90% of locations imposed mandates when deaths reached eight daily deaths per million, according to healthdata.org.
Here is a line graph by Our World in Data representing the change in cumulative COVID-19 cases and deaths per million in Italy.

Qualities of good health data visualization
When health data is transferred between HCPs, you can maintain the technical jargon. However, when health data is transferred from HCPs to patients to support patient-centric care, you need to simplify the information.
Forward-thinking HCPs know that to facilitate the comprehension of health data, they need to continuously discover creative ways to portray complex information.
When utilized properly, your data visualization should use good data, have a clear purpose, and portray great design.
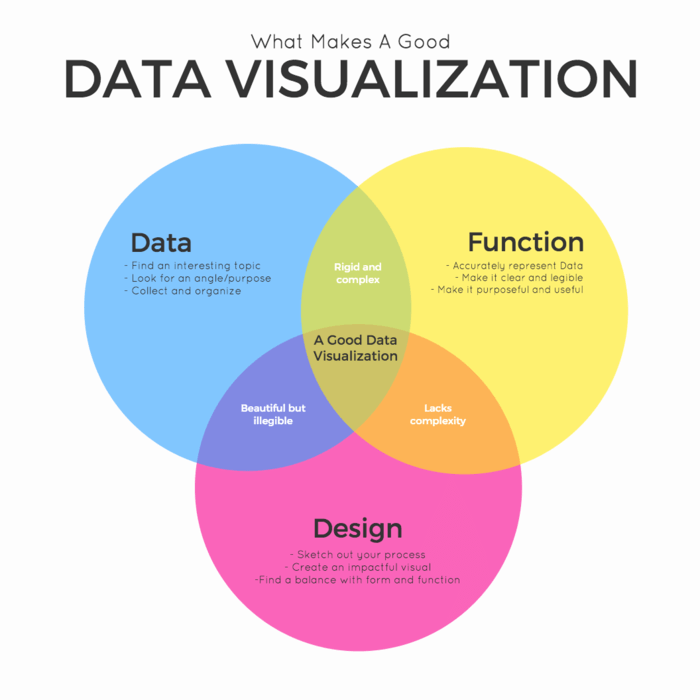
Below, we see an example of data visualization that has all three characteristics.
In this chart, it’s easy to see that the beginning of the year has the largest numbers of inpatient stays, deaths, and emergency department visits.

Examples of data visualization in healthcare
Here are three healthcare data visualization examples:
1. A closer look at cancer. Right away, you can see that this infographic can help Canadian scientists identify the areas that cancer research is needed the most, for example, breast cancer, colorectal cancer, lung cancer, and prostate cancer.

2. Seasonal flu vs. COVID-19 comparison. There has been a lot of comparisons between the flu and COVID-19. This chart can help the public understand how much more dangerous COVID-19 is compared to the flu.

3. Comparing occupancy of hospital beds between metro and non-metro areas. This simple data visualization chart immediately shows that non-metro areas had substantially higher occupancy in their ICU beds due to COVID-19.

Healthcare data visualization FAQ
1. What data visualization tools are used in healthcare?
The best data visualization tools in healthcare are easy to use and intuitive to the user. They take huge sets of data and make them easy to understand.
There are a ton of data visualization tools, but we will list some that healthcare companies use.
- Venngage: Organizations use Venngage to create informative charts and visuals that describe their data. Templates for charts and graphs include Excel integration to import your data.
With Venngage’s easy-to-use Infographic Maker, you can select a professionally designed infographic template or apply your own style to make your infographic unique.
Here’s an example of a simple data visualization infographic created using Venngage.

You can also make healthcare data infographics containing more complex information that can be visualized with charts, graphs or tables, like the one below:
Aside from infographics, Venngage also allows you to create documents like this healthcare annual report, to be shared with other healthcare professionals:

- Tableau (and Tableau Public): Tableau is a visual analytics platform that helps organizations see and understand data. Companies can input data and visualize it in charts, tables, graphs, maps, dashboards, and more.
- Domo: Healthcare companies use Domo to look at data in real-time. You can create pie charts, graphs, and interactive maps.
- Infogram: Healthcare stakeholders can create interactive charts and maps to visualize data using Infogram.
- Chartblocks: Healthcare organizations can import, design, and share their charts right on Chartblocks.
- Google Charts: Google charts use pure HTMP5/SVG technology to help users visualize healthcare data.
2. What types of data visualizations are most used in healthcare?
The types of data visualizations most used in healthcare are charts and graphs.
When dealing with complex data, tables like this one are difficult to digest. However, the data can be better visualized using the graph below.
If you have more data that needs to be visualized in more than one graph, you can incorporate different types of charts, graphs or tables into one infographic so it’s easier to follow:

3. What is the role of data analytics in healthcare?
We live in the era of big data. Large volumes of data (structured and unstructured) continue to accumulate and flow in from various systems.
Health data is increasingly large and complex. Data analytics takes what looks like a complicated puzzle and converts it to meaningful form.
Data visualization goes hand-in-hand with data analytics. The former visually represents complex data, and the latter processes it so that it makes sense before clinical decisions are made.
In summary: Using data visualization in healthcare can help health professionals inch closer to their goal of saving lives
To make sense of healthcare information in a data-driven world, you need to use the best data visualization templates available.
Venngage makes it easy to create charts, graphs, or infographics that help healthcare stakeholders make sense of their data.
You can start visualizing your healthcare data for free with Venngage’s easy-to-use Infographic Maker and hundreds of easy-to-edit healthcare data infographics.