


![16 Visual Content Marketing Statistics to Know for 2022 [Infographic]](https://venngage-wordpress.s3.amazonaws.com/uploads/2021/07/Visual_Content_Marketing_Statistics_2022_Blog_Header.png)
If 2020 was a year full of upheaval, 2021 was full of renewal.
Renewed strategies. Renewed brands. And renewed social lives. (Or at least, initial forays back into society!)
As the pandemic continued to drive consumers online, brands invested in crafting cohesive digital experiences. Meanwhile, digital natives thrived. All of these circumstances contributed to yet another surge in the importance of visual communication.
We know because we asked…
As per custom, Venngage ran its annual survey on visual content marketing, and the results show just how important this medium has become. There were also a few interesting trends that emerged, like rebrands, video… and more video.
So let’s take a look, shall we?
See this year’s results:
- Visual content marketing statistics to know for 2022
- A stat by stat breakdown of 2022’s survey results
Explore results from previous years:
- Visual content marketing statistics to know for 2021
- Visual content marketing statistics to know for 2020
- Visual content marketing statistics to know for 2019
Visual content marketing statistics to know for 2022
The results are in. Here’s an infographic showcasing how marketers around the world used visual content in 2021, and what they predict for 2022:

Note, Venngage welcomes sharing! You have permission to use this infographic on your blog or website. Simply copy the HTML code below to add this infographic to your site. Or, if you’d like to reference a specific statistic or fact, please include a link to this blog post as a source.
<img src="https://venngage-wordpress.s3.amazonaws.com/uploads/2021/07/Visual_Content_Marketing_Statistics_to_Know_for_2022-1.png" alt="16 Visual Content Marketing Statistics to Know for 2022 [Infographic]"/><a href="https://venngage.com/blog/visual-content-marketing-statistics">16 Visual Content Marketing Statistics to Know for 2022 [Infographic]</a> created by <a href="https://venngage.com/">Venngage Infographic Maker</a>
A stat by stat breakdown of 2022’s survey results
Brands are more online than ever. Content is more visual than ever. Rich media, like video, matters more than ever.
Let’s take a closer look at how brands used visuals in 2021 to capture and retain attention online:
1. Did you pivot your visual content marketing strategy in 2021?

The pandemic kept marketers on their toes, and 2021 was no exception. In fact, when asked whether they pivoted their visual content marketing strategy in 2021, 57.9% of marketers answered “yes” — up from 56.6% in 2020.
Interestingly, when asked to elaborate on how they pivoted their strategy in 2021, almost half of respondents mentioned rebranding or refreshing their visual identity in some way. For many, this involved finding how to make a website with high quality and redoing their website, and creating a cohesive online presence.
ZeroBounce’s Corina Leslie shared,
“In 2021, we pivoted our visual content marketing strategy by better aligning it with our new branding. We’d relaunched the website a few months before and wanted our entire visual marketing to reflect that.
So we slowly transitioned to a new visual identity across all channels — our blog, social media channels, email newsletters and automations. Our customers loved the new branding, and we wanted it to be unified and cohesive across all touch points. It’s all part of what creates a meaningful customer experience.”
With businesses reopening and closing… and reopening and closing… there’s no doubt, investing in a cohesive online experience was a good move in 2021. And a move that will continue to pay dividends for years to come.
2. In 2021, approximately what percentage of the content you published contained some kind of visual?
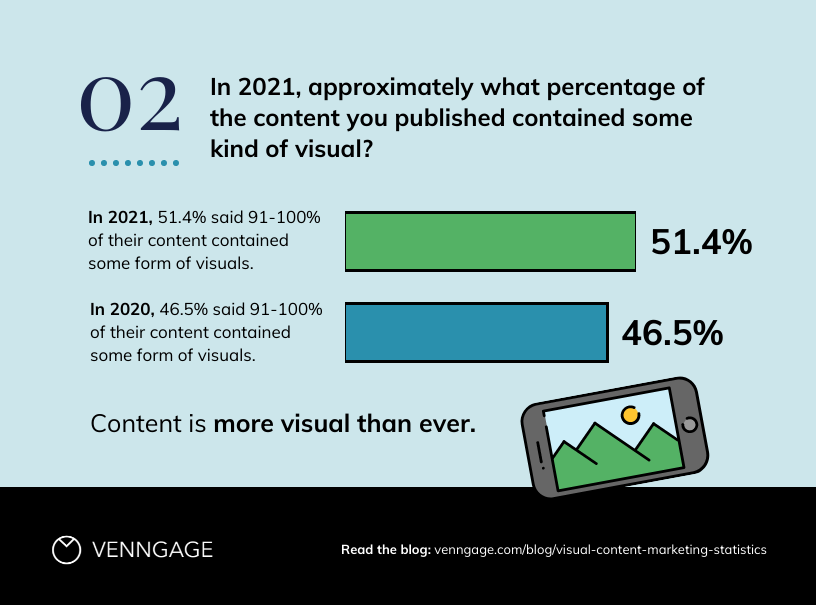
Every year, the use of visuals in content grows. If you look back to our surveys from 2018 and 2019, the majority of respondents said more than 71% of their content contained visuals. In 2020 and 2021, this number grew to 91-100%.
A closer look at the numbers shows that content was more visual than ever last year: 51.4% of respondents said 91-100% of their content contained visuals. This is up from 2020 when 46.5% of respondents said 91-100% of their content contained visuals.
Along these lines, many marketers mentioned creating more platform-specific visuals. Again, this tracks with the times — brands invested in building a better online experience for their customers and target audience across platforms.
Mitangi Parekh, Sr. Marketing Manager of Content at eSentire, shared,
“We introduced different types of visuals that were created specifically for social media (i.e., LinkedIn carousels, static images for statistics, images of quotes for testimonials) and put in more effort to create different types of video formats for social media as well.”
3. What type of visual content did you use most frequently in 2021?

Original graphics, like infographics and illustrations, retained their lead as the most used type of visual content in 2021. They captured this lead in 2020 when 32.5% of marketers said they used original graphics the most. In 2021, that number has grown to 36.4%.
Stock photos came in second at 33.6%. Notably, videos and presentations grew in popularity: 13.1% of marketers reported using this medium the most. Considering the surge in webinars last year and the struggle to capture attention online, the rise of video makes a lot of sense.
Bringing up the rear, 6.5% chose charts and data visualizations, 5.7% GIFs and memes and 4.7% multi-page lead gen docs (like eBooks and white papers). Though a small percentage, this is the first time GIFs and memes made the list. Perhaps, we’re seeing the popularity of branded memes coming into play here.
4. / 5. What type of visuals performed best for you in 2021? What type of visual performed worst for you in 2021?

Again, original graphics were number one with 41.1% of marketers saying these visuals performed best for them in 2021. On the flip side, 41.1% said stock photos performed worst in 2021. Yet, as we saw, stock photos are the second most used visual. We can surmise that though marketers need stock photos, they don’t necessarily see results from them.
Videos and presentations were the second most helpful type of visual content: 23.4% of marketers voted for these mediums. Charts and data visualizations and stock photos tied for third in terms of best performing visual content. Multi-page lead gen docs won 10.3% of the vote and GIFs and memes came in at 2.8% (which is still more than in 2020 when they received no votes at all!).
These trends reflect in the reverse vote: multi-page lead gen docs came in second for the least helpful type of visual content with 17.8% of the vote. Surprisingly, GIFs and memes didn’t surpass multi-page docs: 16.8% voted for them. Charts and data visualizations came in at 10.3%, original graphics at 7.5% and videos and presentations at 6.5%.
6. How much time, on average, did you spend in a week on producing visual content in 2021?

The majority of marketers reported spending on average two to five hours a week producing visual content. On the whole, the numbers for 2021 mirror 2020:
- 24.3% spent two to five hours vs. 28.3% in 2020
- 23.4% spent less than two hours vs. 20.5% in 2020
- 19.6% spent five to 10 hours vs. 22.3% in 2020
- 14.9% spent 10-15 hours vs. 15.1% in 2020
- 17.8% spent 20+ hours vs. 13.9% in 2020
As you can see, almost half of marketers spent five hours or less producing visual content a week. Yet, as we saw earlier, the majority also reported 91-100% of their content contained visuals. This suggests marketers have efficient tools and systems in place to produce visuals.
Venngage, anyone? Speaking of which…
7. What do you typically use for creating your visual content?

An online tool or graphic maker, like Venngage, is what 35.5% of marketers use for creating visual content. A lucky 28% have access to an in-house designer, while 18.7% use advanced design software themselves. Finally, 17.8% rely on freelancers to get the job done.
Though these numbers are similar to 2020’s, it’s interesting to see a slight bump in the amount of marketers working with in-house designers and freelancers. With the increase in visual content production, it follows there would be more demand for these skills — both in-house and externally — in order to keep up at scale.
8. What is your biggest struggle when it comes to producing engaging visual content?

Producing visual content consistently is still marketers biggest challenge: 31.8% thought this struggle was real. But this year, sourcing data and statistics or writing copy came in second with 26.2% of marketers relating to this challenge. In 2020, this challenge came in last at 19.9%.
With the glut of companies now conducting surveys and research, it’s true, it can be difficult to source good data. (But clearly, you’ve come to the right place! We’ve been doing this survey since 2018 and our methods are sound.)
Content production is also at an all-time high with companies pumping out blogs daily. Perhaps, this factors into the difficulty some face when looking for writing support.
Moving on, 22.4% of marketers struggled with finding the right layout for their data, statistics or copy. And just 19.6% said great design was their biggest challenge. It seems marketers are better than ever at design. (My money’s on professionally-designed templates helping out here!)
9. In 2021, what percentage of your marketing budget did you spend on producing visual content? What do you project in 2022?

Though production was high, budgets were low in 2021 — 25.2% of marketers reported spending 0-10% of their budget on producing visual content. This is down from 2020 when the majority said they spend 21-30% of their budget on visual content.
However, when it came to projecting how much they’d spend in 2022, marketers said 21-30% of their budget would go to visual content. This is a big jump from 2021 and lines up with the increase in visual content across the board.
Will this prediction stand with the economy and the world as a whole in flux? My guess is yes. It’s simple math: companies need to stand out online and visual content is the way to do it.
10. What do you spend the most on budget-wise for visual content?

Design remains the number one cost for 28% of marketers. Tools and software is number two at 27.1%. (Makes sense!)
More marketers than ever reported spending the most on video in 2021 — 23.4% compared to 19.3% the previous year. Animation and interactivity also won more votes in 2021 — 12.2% compared to 9.6% in 2020. And stock photos continue to claim around 9% of votes.
Overall, more marketers are allocating their budgets to rich media, like video, animation and interactivity, than ever before. All hail the online era.
11. On a scale of 1-10, how difficult is it to produce visual content consistently for your brand?

When it comes to producing visual content consistently, 56% of marketers rated the difficulty of this undertaking between five and seven. That’s not bad when you consider marketers identified this as their number one challenge earlier on.
Of the remaining marketers, 23.3% gave a difficulty rating of 4 or less, while 10.6% gave a rating of 8 or higher. All in all, the distribution skews towards an easier difficulty level — although some marketers still struggle quite a bit.
A tool like Venngage, with its large library of templates and user-friendly visual editor, can help alleviate the difficulty of creating visual content. In fact, our mission is to help everyone — regardless of design skills — communicate their ideas visually.
12. If you could simplify or automate one part of creating visual content, what would it be?

Auto-generating multiple design types, like infographics, reports and eBooks, remains the number one wishlist item for marketers. This year, 36.5% responded they would like this ability. But this is actually down from 2020 when 39.2% of marketers voted for this ability.
Meanwhile, the ability to resize or reformat visuals for various social media platforms automatically rose in demand: 26.2% of marketers chose this option compared to 20.5% the previous year.
Again, we may be seeing the effects of brands investing more in their online presence. Platforms like TikTok and LinkedIn are more popular than ever and marketers have had to learn quickly to adapt to these different channels.
The remaining results are consistent with previous years: 14% voted for applying branding automatically, 14% voted for real-time collaboration and 9.4% said they wouldn’t want to automate anything.
13. How essential is visual content to your marketing strategy?

Very important! That’s what 50.5% of marketers said when asked how essential visual content was to their marketing strategy. This is in line with 2020’s responses when 52% chose very important.
Notably, not one marketer responded that visual content wasn’t important to their strategy this time. In 2020, 1.8% chose this response. There was also an increase in the amount of people who said their strategy is nothing without visual content: 13.1% chose this option compared to 9.4% in 2020.
The moral of the story? Visuals are more important than ever.
14. Which platform did you create the most visual content for in 2021?

As in previous years, the majority of marketers said they created the most visual content for their blog: 30% voted for this option. But this is actually down from 2020’s results when 35.5% of marketers chose blog content.
Again, we’re seeing an increase in investment on social platforms. Specifically, 15.9% of marketers responded they created the most visual content for LinkedIn in 2021 — up from 12% in 2020 and surpassing Instagram this year. Facebook still outstripped LinkedIn in coming in at 18.6%.
As we touched on earlier, many marketers mentioned creating more tailored content for social media channels in 2021, so these findings line up. Joseph Karim, the Senior Product Marketing Manager at Paymentus, explained why this is a good move:
“Companies that invest in creating platform native content (think charts and insights for Twitter and Linkedin, or fun meme videos on TikTok), will see an outsized impact. Those that create content designed to get clicked through to their website will continue to struggle getting traction, as these algorithms incentive more time on the platform.”
Finally, 13.1% went with landing pages and 9.3% chose print and branding materials. These numbers are up from 2020 as well when 12.7% went with landing pages and only 6.6% chose print and branding materials.
The amount of respondents who mentioned rebranding may explain the more significant difference in numbers for print and branding materials.
15. How frequently did you publish content that contained visuals in a given week in 2021?

So, how often do marketers publish visuals? Two to five times a week, according to 38.3% of our survey respondents. Coming in second, 28% of respondents said they published visuals five to 10 times a week.
Of the remaining marketers, 17.8% chose less than two times a week, while 15.9% were super publishers and chose 10+ times a week.
But overall, the most common answer falls somewhere in between. If you tally up the top two responses, 66.3% of marketers published content with visuals between two and ten times a week. That’s a pretty healthy cadence!
16. By the end of 2022, what percentage of businesses do you think will rely heavily on visual content as part of their marketing strategy?

Earlier, we saw how visual content is more important than ever to marketing strategies. So, it follows 28% of marketers predicted 71-80% of businesses will rely heavily on visual content by the end of 2022.
This was by far the most common response. The remaining votes fell primarily between 41% and 91-100%. Again, these findings line up with the rise of visual content across the board.
Do you have any other predictions or insights to share on visual content in 2022?

A common theme quickly emerged when going through the responses to this short answer question: video.
Some marketers talked about how social media algorithms favor video, and how we’ll see more companies adopting this medium frenetically. Others mentioned the difficulty of producing this type of content and how marketers will have to find solutions.
As Alison Fisher, the Demand Generation Manager at Manifest Climate, explained, “Video content is harder to produce consistently than graphic content because it’s not a skillset that most marketing teams have in house. A way to streamline video content would make it a lot easier to produce consistently.”
You’re up, video companies! (P.S. Venngage offers a simple video editing tool as well. Use it to make quick clips for social media, internal comms and more.)
In sum, I’ll leave you with the succinct words of John Lawless, the SEO & Content Manager over at bestheating.com, “It’s always going to be more video.”
Visual content marketing in 2022 and beyond
In this day and age, eye-catching visuals aren’t just a nice-to-have. They’re a must-have for brands to stand out and engage audiences online.
But visual content continues to evolve with marketers adopting rich media, like video, animation and interactivity at a quick clip. To keep pace with these developments, marketers need efficient processes and tools to streamline visual content creation.
Do you agree? What are your favorite tools for creating visual content? Any insights you’d add to this year’s visual content marketing statistics report? Let us know in the comments below!
Start creating stunning visuals with Venngage — no design experience required.
Visual Content Marketing Statistics to Know for 2021
We surveyed 200 marketers about their visual content usage in 2020 and asked them about their predictions for 2021. As expected, the pandemic played a large part in the trajectory of the results which we will also examine here.
To showcase our survey results, here’s an infographic with a summary of the data we collected.

Visual Content Marketing Statistics to Know for 2021
The digital world is inundated with marketing messages. To rise above the noise, you need to create content that not only attracts attention but maintains it. That is where visual marketing comes in.
Here are the key takeaways from our survey of content marketers around the world about how they adapted their visual marketing strategy for the pandemic, what visuals they used, and the tools they employed to design visual content.
1. Did you pivot your visual content marketing strategy in 2020 based on the pandemic?
Unsurprisingly, the pandemic had an impact on visual content marketing. With most companies going virtual, marketers needed to get creative to keep audiences engaged.
When asked if the pandemic changed business communication strategies, a majority of our respondents replied in the affirmative. 56.6% said they did have to pivot their strategy in light of the global changes, with 43.3% saying it was business as usual despite the global circumstances.

2. On a scale of 1-10, how much did you change your visual marketing strategy due to the pandemic?
We also asked marketers how much their visual marketing had to be adapted because of the pandemic. As expected, everybody responded saying they had had to change in some way.
Most responses fell in the middle, between five and eight out of 10, which was to be expected from the results of the first question. An average of 6.6 was the scale of change, showing that marketers had to make significant changes to their visual content marketing strategy in 2020.

3. What kind of visuals did you use most frequently?
Over the years, we have seen more marketers incorporate visuals into their content. In 2018, marketers said that about 64% of their content contained visuals. In 2019, that number jumped to 74%.
In 2020, the majority of content marketers surveyed said 91-100% of their content includes visuals. This was the response from 48% of respondents.
23% of those surveyed said they included visuals in 70-90% of their content. 8% include visuals in 61-70% of their content and 4% add visuals to 11-20% of their content marketing materials.
Since so many marketers now use visuals in their content marketing efforts, we were curious to know what kind of visuals were used regularly.
In past years, stock photos had been the clear winner, though its lead had been diminishing. Interestingly, that streak ended in 2020.
The marketers surveyed use original graphics such as infographics and illustrations more frequently. 32.5% of respondents said they used infographics more than any other type of visual. 29.5% said they still use stock photos, a decrease from the previous year’s 34%.
While charts and data visualizations were only used by 8% of marketers in our previous survey, that number has jumped to 15% this time. We have seen more data visualizations being used in media and marketing throughout 2020, so this significant increase does not come as a surprise.

Videos and virtual presentations, which have regularly ranked higher for this question, fell to fourth place. We had predicted an increase for 2020, but the pandemic had other plans. Only 13% of respondents said they use these types of visuals in their content marketing.
And finally, 5% of respondents mentioned multi-page lead generation documents as their go-to visual in 2020. This media type has consistently ranked at the bottom for this question. But considering how labor-intensive it is to create a multi-page document, we can understand why it hasn’t ranked higher.
GIFs and memes continue to be the least used in visual content marketing. However, while in 2019, less than 1% used GIFs, in 2020, that number rose to 4.7%.
4. Which type of visuals helped you reach your marketing goals in 2020?
Since original graphics topped the list of visuals used most frequently, it was expected that they would feature at the top for visuals that helped marketers reach their goals. Almost 41% of respondents said infographics and illustrations are the most effective for achieving their goals.
Though videos and presentations came in lower on the list for types of visuals used, they ranked second for effectiveness, with 24% of respondents voting for them.
Charts and data visualizations followed at 15%. Stock photos were the second-most type of visual used but they were only impactful for 9% of marketers, followed closely by multi-page documents at 8%. GIFs and memes rounded off the category with 3%.

5. Which type of visuals did not help you meet your marketing goals?
Interestingly, when asked about the least-effective visuals for reaching marketing goals, the results overwhelmingly skewed towards stock photos, at 41%.
Multi-page documents and GIFs received 19.5% and 19% of votes from respondents as the least effective. Charts and data visualizations were much more effective, and only received 9.5% of votes for this question.
Original graphics were the most effective visual for marketing, as seen in the previous question, and received less than 8% of votes for this section.

6. How much time did you spend each week producing visual content?
As in 2019, about 50% of respondents in 2020 said they spend less than five hours a week producing visual content. 22% said they spend 5-10 hours creating visual content, while 29% spent between 10 hours to more than 20 hours creating visual marketing content.

It looks like marketers have become more economical with their time when it comes to visual content creation since more of them are taking less time to deliver high-quality content.
7. What tools did you typically use to create the visual content?
While in previous years, marketers were hiring more in-house designers and freelancers to create content, since 2019, there has been a distinct move towards using online graphic solutions like Venngage, or design software.
41% of respondents said they use online solutions, while 19% use advanced design software. In-house designers are used by 27% of the marketers surveyed, and only 16% used the aid of a freelance designer in 2020.
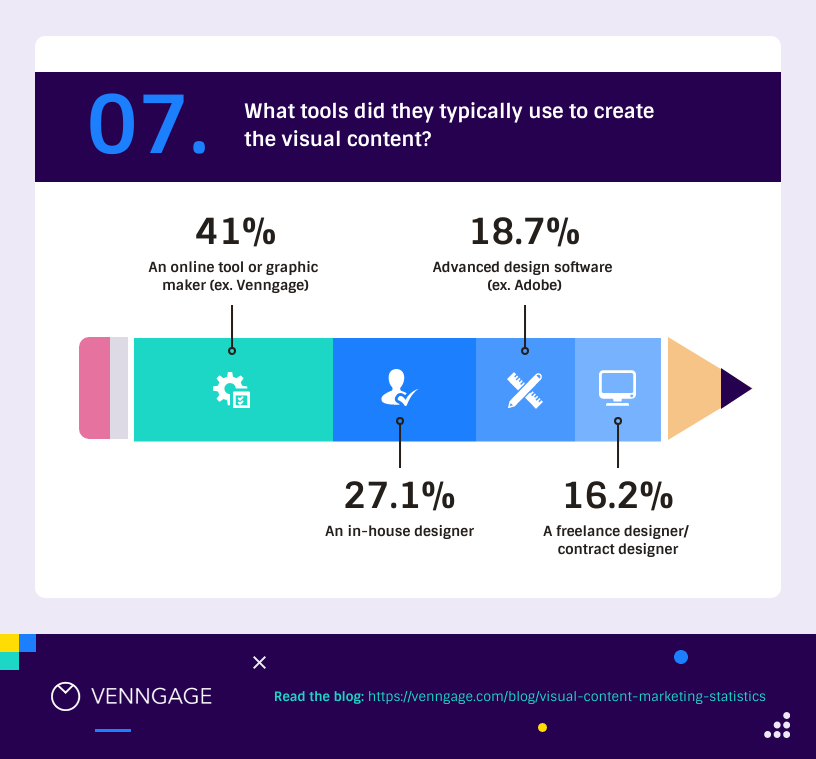
This can only mean that more marketers are becoming self-sufficient when it comes to creating visual content for their marketing, instead of having to rely on external support.
8. What was your biggest struggle when it came to producing engaging visual content?
With so much visual content being distributed over the past few years, we regularly ask content marketers what roadblocks they face in creating visual posts.
In the previous year, 43% of those surveyed said they struggled with producing visuals regularly, but that number has dropped significantly to 37%. This could be because marketers have more access to visual content solutions now.
Finding the right layout to show data and statistics jumped to second place this year, with 23% of respondents saying that it was their biggest hurdle.
Designing good infographics had been the second-biggest roadblock for marketers but it dropped a spot in 2020 with 20.5%. Sourcing data and statistics remained fairly consistent in the rankings of struggles, with 20% of the votes from those surveyed.

9. What percent of your budget was spent on visual content in 2020, and how will that change?
Since we started conducting this study, we have seen a marked rise in businesses allocating budgets to the creation of visual content. While the majority of those surveyed in previous years said that less than 10% of their marketing budget was allocated to visual content, that has now changed.
25% of those surveyed said that less than 10% of their marketing budget would be spent on visual marketing, while 27% said 21-30% of the budget is being allocated for visuals.
24% of respondents are spending between 11-20% of the budget on visual content marketing and 7% of marketers spent up to 50% of their budgets on visuals this year.
How is that going to change in the coming years? We asked our respondents to predict budgetary spending for visual content marketing for 2022.
23% predicted that marketing spend would increase to 21-30%, followed closely by 21% saying their budgets would reach the 11-20% category.
17% believe their budgets for visual content creation would be less than 10% in 2021, while 15% predicted an increase into the 31-40% bracket. 10% believe their marketing budget spend will increase to 50% for visual content.

10. What do you spend the most on for visual content?
With a significant portion of marketing spend going into visual content marketing, what exactly are content marketers spending their money on?
34% of marketers said that budgets are allocated specifically for designing visual content, while 28% are using the budget on tools and software. 19% is spent on video production. Animation and interactivity and stock photos ranked lowest with 10% and 9%, respectively.

We also wanted to know how difficult it was for marketers to produce visual content consistently for their brand. The average for marketers was 5.8 when asked about the level of difficulty, on a scale of 1-10. Most rated it between five and eight on the scale, comprising 68% of the results.
11. If they could automate one part of creating visual content, what would that be?
Automation has become a must-have in content marketing. As in previous years, the marketers surveyed chose auto-generating multiple types of design as their top pick, with 39% selecting this option.
20.5% of respondents wanted more auto-resize options for social channels. 16% wanted team collaboration to be better automated, especially because of the rise in working from home as a result of the pandemic.
15% hoped for better automation when applying branding across visuals, a number that has not changed since our previous survey.

With Venngage for Business, marketers can access a variety of features including live team collaboration, auto-branding, and automatic resizing, along with priority support.
12. How essential is visual content to their marketing strategy?
The majority of marketers surveyed said that visual content is a key component of their marketing strategy. 64% said that visuals were either essential or very important.
31% of respondents believe visuals are quite important or somewhat important for their marketing. Only 9.6% don’t require visuals for their content marketing.

13. Which platforms do they create visual content for primarily?
We also asked marketers what platforms they regularly create visual content for. We noted a marked shift towards social content this year over previous years.
48%, the majority of respondents, still create visuals primarily for blog posts and landing pages. But 45% create visuals for a variety of social channels such as Facebook, Instagram, and LinkedIn. Only 7% of respondents use visuals for print or branding materials.

14. How frequently do they publish content that contains visuals each week?
As a follow-up, we also asked marketers how often they publish content with visuals in a given week. 41% said they publish visual content between two to five times a week. 26% published even more visual posts, between five and 10 times a week.
17% of respondents published visual content more than 10 times a week, and 14.5% published posts with visuals less than twice a week.

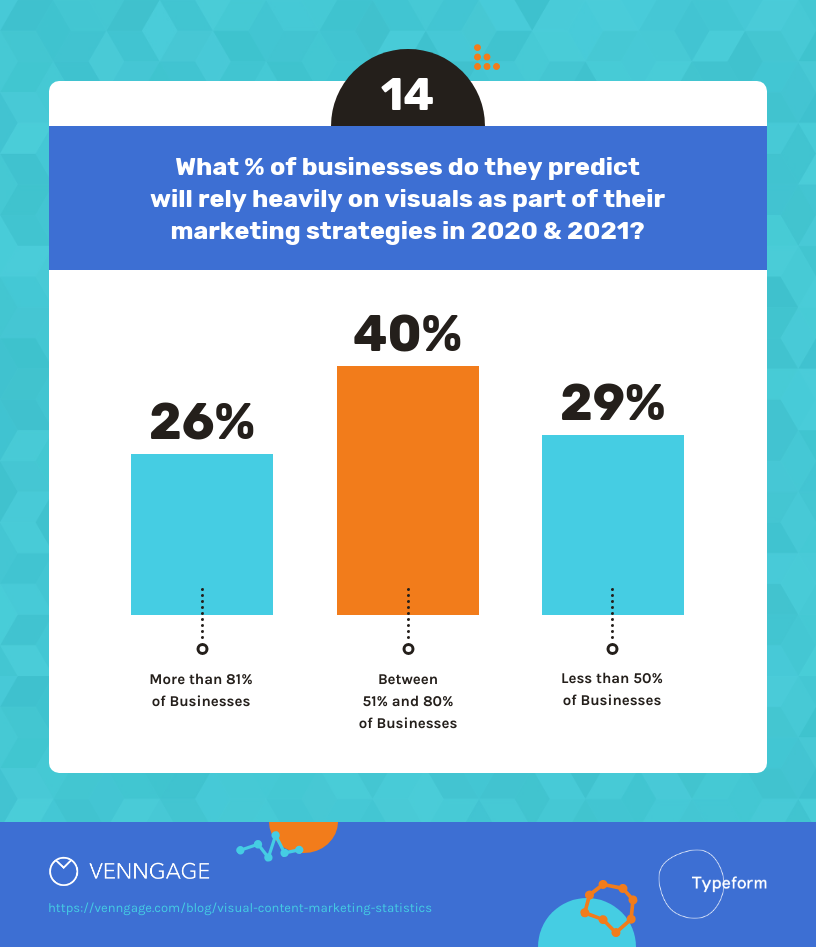
15. In 2021 and 2022, what percentage of businesses do you think will rely heavily on visual content as part of their marketing strategy?
In our final question to marketers, we asked them to share their predictions on how many businesses are likely to rely on visual content marketing in 2021 and beyond. The majority, 63%, believe that over 60% of businesses will rely heavily on visuals.
22.5% of respondents said that between 30-60% of businesses will be using visuals this year and into the next. Only 14% said that less than 30% of businesses will use visual content in their marketing strategy.

Conclusion
Visual communication continues to be a driving force in the content marketing arena. We’re seeing more marketers and businesses embrace the benefits of using visuals across their marketing channels. This is one strategic move that is going to become more crucial every year.
Do you have any other marketing insights to share about visual content? Have success stories about using visuals in your marketing strategy? We’d love to hear all about it. Leave us a comment and share your visual content story with us.
Not a designer? No problem. With Venngage, you can start visualizing your ideas without any design experience.
Visual Content Marketing Statistics to Know for 2020
Over the last five years, there has been a significant increase in remote work and virtual events. More and more companies are conducting business virtually and because of this, the need for more efficient and engaging communication is also increasing.
Visual content is an incredibly effective way to communicate via virtual channels and its use will only increase in importance in 2020.
Every year, Venngage releases this study on visual content marketing statistics in an effort to understand how the visual communication landscape is continuing to shift.
We reached out to thousands of marketers (with the help of our friends at Typeform) to ask them about how visual content played a part in their marketing and growth strategies in the past year, and how they foresee visual content impacting their work in 2020 and the years to come.
-
- Feel free to jump ahead and view the reports from:
Nearly 200 content marketers shared their insights with us this year, and we decided to feature some of their predictions for the upcoming year as well.
Here’s the infographic that summarizes the results from the survey, followed by some thoughts from the best and brightest in content marketing:

Not a designer? No problem. Create an engaging infographic with Venngage’s Infographic Maker and easy-to-edit templates.
Visual Content Marketing Statistics to Know for 2020
If you want your marketing message to stick, you need to present it to people in a memorable way. Show people that message. Don’t just say it.
The following are the main takeaways from experienced content marketers all over the world about how they have used, and plan to continue using, visuals as a tool in advertising and marketing.
1. How did the use of visual content in marketing change for you from 2018 to 2019?
Content marketers were asked to compare approximately how their use of visuals in marketing changed between 2018 and 2019.
In 2019, 74% of the marketers we surveyed stated that more than 70% of their content contained some form of visual. This was a 10.5% increase in visual content use from what these same marketers claimed was the case in 2018.
In other words, the use of different visual formats has seen a significant increase over the past year.

2. What type of visuals were used most frequently in 2019?
We were also curious to understand how content marketers defined visual content. More specifically, we wanted to learn what types of visuals were used most frequently in 2019.
The results were quite similar to previous years, with 40% of marketers claiming to use stock photos most frequently. After stock photos, 34% of marketers claimed to use original graphics such as infographics and illustrations, followed by 14% claiming to use videos and presentations (including formats like webinars and slideshows).
The use of video and presentations saw the most significant increase compared to previous years where only 7% of respondents were making use of these two visual formats. Virtual training and communication will likely continue to increase as a means of engaging internal teams as well as external audiences.
Reliance on video and presentations is sure to skyrocket in 2020 as virtual events become a necessity in the workplace.

Charts and data visualization were the most frequently used by 8% of marketers. Multi-page documentation such as white papers and ebooks were used the least frequently.
Less than 1% claimed to use GIFs as their primary form of visual content, a major drop from previous years where more than 3% of marketers claimed to make use of GIFs and memes most frequently.
3. Which type of content in 2019 performed best for you and your marketing goals?
Despite using stock photos most frequently, when asked which type of content actually performed best, the data shifts a little bit. The winner when it came to actual results was original graphics such as infographics and illustrations at 40%. This was followed by videos and presentations at 24%.
Only 13% of marketers claimed that stock photos resulted in the best outcome, followed by 9% claiming charts and data visualizations were the most impactful.
Multi-page docs proved to be the best performers for 7% of marketers, and GIFs and memes came in last at 3%.

4. How much time was spent on average producing visual content in 2019?
When it came to how much time was spent on visuals, 50% stated that they spent less than 5 hours a week creating visuals. This is interesting since in past years more than 70% of respondents claimed to spend less than 5 hours on visual creation.
All this means is that more people are now dedicating much more time to the creation of visual content, likely in an effort to produce higher-quality content on a more consistent basis.

5. What methods or tools were typically used to create visual content?
In previous years, in-house designers and freelance designers were most frequently used for creating visual content.
However the results from this year’s survey show that beginner software like Venngage and more professional software like Adobe Photoshop and Illustrator are the go-to methods for creating visual content for marketers at 55%.
Meaning that the majority of marketers now use self-service tools for creating visual content as opposed to hiring outside design support.
Freelance and contract designers were only used by 15% of marketers, and in-house designers were the go-to solution for 29% of marketers.

6. What were the biggest struggles when it came to producing engaging visuals?
When asked what the biggest struggles were with producing engaging visuals, 43% claimed it was producing that content consistently.
22% stated that both great design and sourcing relevant data were the biggest struggles, followed by 12% stating that structuring content and data for a good visual was the biggest challenge.
Pro tip: For those struggling to source data, running surveys is a great way to gather interesting insights and creating original research. In fact, we used Typeform to create the survey form for this study.
Compared to previous years, there is a 23% increase in the number of marketers finding it more difficult to produce visuals consistently.

7. What percentage of marketers’ budgets was spent producing visuals in 2019?
Of the marketers surveyed this year, 31% claimed that less than 10% of their budget was spent on visual content creation. Close to 15% claimed to spend more than 40% of their budgets on visual content creation.
Based on previous years, it seems that more people are investing more money in visual content production and seeing the value of visuals.

8. How will that change in 2020?
When we asked how much of their budgets they predicted would be investing in visual content in 2020, 25% anticipated spending between 10 and 20% of their total budgets on visual content creation.
In comparison, 31% foresee spending more than 40% of their budgets on visual content production.
Needless to say, more and more marketers are seeing the value of visual marketing.

9. On a scale of 1 to 10, how difficult is it to produce visual content consistently for your brand?
The average rating for all respondents was 5.9 when expressing how difficult it was to produce visual content consistently. The majority of those surveyed rated between 6 and 8, making up 51% of the results.

10. What part of the visual content creation process would you want simplified or automated?
Not surprisingly, the majority of those surveyed stated that the ability to auto-generate multiple design types based on the content input was most desired. The particular preference was selected by 37% of marketers surveyed.
Following this, sitting at 22%, was the ability to resize and reformat visuals for various social media platforms automatically.
Next, 15% wanted to apply branding to their visuals automatically.

Want to automate your visual content creation? Try Venngage for Business and access features like automatic resizing, auto-branding, and smart design generations.
11. How essential is visual content to your marketing strategy?
When asked how essential the use of visuals was for their marketing strategies, 68% stated that visual content was either essential or very important to their marketing strategies.
No one claimed that visual content wasn’t at all important, and the remainder said that it was either quite important or somewhat important.

12. Which platforms do you create visual content for primarily?
When asked where marketers used visual content most frequently, we asked marketers to select all options that applied. 62% of them mentioned using visuals as part of blog content or for landing pages on a website.
Social media was a major use case for visual content with 49% using visuals for Facebook, 47% using them for Instagram, 42% using them for LinkedIn and 33% using them for Twitter.
Lastly, 43% stated using visuals for print and branding materials. The remainder selected other as an option.

13. How frequently do you publish content that contains visuals in a given week?
We also asked marketers how frequently they published the above mentioned content that contained visuals in a given week. 39% said it was anywhere between two and five times a week, 36% said less than twice a week and the remainder published content containing visuals more than five times in a given week.

14. In 2020 and 2021, what percentage of businesses do you think will rely heavily on visual content as part of their marketing strategies?
Finally, we asked respondents to share their thoughts about what percentage of companies will rely heavily on the use of visual content in 2020 and 2021. 41% think that more than 70% of businesses will rely heavily on visuals as part of a marketing strategy.
Only 1% thought that less than 10% of business would be relying on visuals.
15. In the last decade, what were some of the biggest wins for content marketing in general?
This year we also decided to ask some of the marketers we surveyed to share their insights about the biggest wins for content marketing and design over the last decade. Here’s what some of them had to say:
Taylor Patterson
Social Media Content Specialist
Materion
Showcasing subject matter experts on video which generated a conversation around topics pertaining to target industries and product knowledge.
Margot Mazur
Sr. Marketing Manager
Hubspot
Video!
Matt Janaway
CEO
MarketingLabs
Finally, businesses have begun to see the power of content marketing as a way to generate new customers!
Shane Barker
Founder
shanebarker.com
The biggest win would be the move from text-heavy long-form content to shorter, more visual content. People now have shorter attention spans and you want content that can immediately grab audiences’ attention and keep them engaged. Visual content does that very well.
Adding to the above point, I think the rise of ephemeral content is also exciting. Instagram, Facebook, WhatsApp, and a lot of social media platforms now have the “Stories” format. The fact that this content disappears after a set amount of time is what makes it more engaging.
Nathan Chan
CEO
Foundr
The power of video content.
Derric Haynie
CEO
EcommerceTech
Objectively, it has to be the Google algorithm updates that penalized black hat strategies and forced all marketers to focus on user experience and unique value.
Amanda Levine
Content Marketing Manager
Clearbanc
Content marketing wasn’t even a thing a decade ago. The fact that brands now realize how important education is to nurture customers along their entire journey is a huge win.
Aditya Sheth
Content Marketer
Venngage
Focus on quality over quantity and more dense content over shallow filler content.
Ben Sailer
Inbound Marketing Director
CoSchedule
In the last decade, content marketing has developed broader awareness as a necessary business function for companies that want to compete on the leading edge. Now that it has become nearly synonymous with marketing itself though, the next decade must be focused on continued innovation in order to better meet customer needs and market demands.
Andy Crestodina
CMO
Orbit Media Studios
Original research, social media video, influencer marketing and collaborative content.
William Harris
Advertising Strategist
Elumynt
I love that brands seem to be finally sensing the shift away from just “a blog” – that they realize the value in images and videos produced for the specific channel, not just “repurposed”.
Vince Nero
Director of Content Marketing
Siege Media
Google algorithm changes that penalize garbage sites that have no trust signals.
Aaron Orendorff
VP of Marketing
IconicContent
Given the proliferation of content, the biggest wins belonged to the smallest segment: those who took serving, educating, and challenging their audiences. For them, the wins were enormous — across both B2B and B2C: owned organic traffic, consistent and qualified leads, as well as fiercely loyal customers turned evangelists.
Jennifer Cardenas
Director of Operations
Codeless
Unique, relatable visuals (getting away from stock images).
Stacey Papp
Internal Communications Manager
Materion
We acclimated our entire employee base to actually wanting to see infographics and visuals versus long-form articles. That was a huge departure from previous thinking…most people thought that the only form of content that existed was long-form because that’s all they were used to. We incorporated visuals on a regular basis and the feedback we have been given on those posts is truly remarkable. People are more engaged, they are in awe of the design and we have actually brought a lot of design work we would typically outsource in-house for production.
Cara Hogan
Content Strategist
Zaius
Video! More marketers are investing in high quality video content.
Nina Mikryukova
PPC / SEM Campaign manager
Daze
Inventing some crucial rules for visual performance (including UX) of blog content to make it more attractive and pleasant to read through for a wider audience than a professional one.
– – – –
Over the last decade, content marketing started to consider how audiences experienced and wished to consume content. That’s why we saw a clear shift towards visual content that was attractive, engaging, scannable, easier to retain and still highly informative. Visual blog content and educational video content became a growing trend.
There was also a trend towards educating audiences in order to drive sales and conversions. Content marketing aimed to provide audiences with all the information they needed to make informed, responsible decisions when it came to making a purchase. This developed brand authority and trust through reliable, in-depth content.
Finally, some marketers felt Google’s improved ability to reward relevant, quality content was a significant win for content marketing in general.
16. What do you think some of the biggest wins for design and visual content were specifically in the last decade?
Josh Steimle
Founder
Influencer Inc
Better, more affordable stock photography. Stock photography gets a bad rap, but I was buying stock photography 20 years ago and it cost 20x as much, and was 1/20 as good. If you think the current stuff is cheesy, you should have seen what it used to look like.
Julia McCoy
CEO
Express Writers
Creativity, hands-down. I’ve seen some incredibly creative campaigns, and visually, you can get across quite a message with amazing digital artwork. As they say, “A picture is worth a thousand words.
Brad Smith
Founder
Codeless
Online platforms for design (simple, DIY for non-designers).
Shane Barker
Founder
shanebarker.com
Podcasts and webinars have become more popular and are getting much higher engagement rates than most other types of content. Videos were a clear winner when it comes to the most popular content type. The rise in popularity of video content, any type of videos, was the biggest win for visual content.
Josh Gallant
Senior SEO Strategist
Foundation
Designing and creating visuals become *a lot* more accessible (more tools than just Adobe) and people seemed to gravitate toward anything that wasn’t just words.
Joel Klettke
Owner
Business Casual Copywriting
Accessibility of affordable tools and talent, growth of productized services.
Patrick Whatman
Head of Content
Spendesk
GIFs and other simple video snippets that are definitely eye-catching.
Benyamin Elias
Content Marketing Lead
ActiveCampaign
Democratization of design. It’s easier than ever for non-designers to create design assets.
Stephen Jeske
Senior Content Strategist
MarketMuse
Visual design software has improved tremendously enabling non-designers to create decent looking visual elements.
Ashley Mason
Senior Consultant, Project Manager and Team Lead
Clemson University
Interactive visual content, content based on your search history or preferences, the ability to filter the type of content you want to see, the ability to track the reach of your content, the ability to go “viral.”
Matteo Gasparello
Founder
Strategico
The advent of interactive content has combined the two major powerhouses that fuel content marketing today: visual content and content that is tailored to the audience. These different types of interactive content provide a personalized experience to each user that makes lead generation and customer acquisition a cakewalk!
Etee Dubey
Content and Outreach Specialist
Outgrow.co
Visual content is not just “beautiful” anymore. It’s not a commodity but it’s essential to deliver a great content experience.
Elena Perri
Communications Manager
BrynMawr Presbyterian Church
The various tools to design content have expanded, and they are more user friendly.
– – – – –
The majority of responses we received from company founders and marketers centered on this: The access to simple, online design tools has been a visual-content game changer for content marketing.
Over the past decade, creating high-quality designs for a blog post, eye-catching social media designs, a stunning infographic, and other types of content have become easier than ever! A hefty design budget, an experienced design team and costly design software were no longer needed for content marketing.
Instead, entrepreneurs without a budget, nonprofits, early-stage startups, and small businesses were all able to create engaging visual content that spoke to their audiences. They were also able to compete with the established brands and corporations that typically had unlimited budgets and huge teams.
Beyond visual content, our respondents also felt that content-creation platforms in general have become more accessible. Recording podcasts, launching a web series, finding quality content creators or hosting webinars have all become easier and easier to do.
Conclusion
We’ve said it before, and we’ll say it again: visual communication is not going anywhere anytime soon. If you aren’t already creating visuals as part of your marketing strategy, it’s not too late to start adding it to your content calendar.
Have some other insights to share about your visual content success? Leave us a comment and tell us about it!
Sign up for Venngage and start visualizing your ideas, without a designer:
Visual Content Marketing Statistics to Know for 2019
Two years ago I asked 300 different online marketers to help me figure out how they were using visual content as part of their marketing strategies in 2016 and their predictions for 2017.
You can jump ahead in this article to look at the results from that survey by clicking here.
This year I wanted to see if there were any changes in how marketers were creating visuals, and what kind of content engagement they were seeing.
I also asked a couple of additional questions to see how the use of various visual formats impacted their blogging strategies.
Here’s the infographic with the results of the survey:

Visual Content Marketing Statistics to Know for 2019
Here are the stats you need to know if you want your content marketing strategy to be ahead of the curve in 2019.
1. How did the use of visual content in marketing change from 2017 to 2018?
When asked, 44.6% of marketers stated that between 91-100% of content their published in 2017 contained some type of visual. This is about a 10% increase from what was stated in the year 2016, when we first put together this survey.
However, in 2018 the percentage of people who visuals in their content 91-100% of the time rose to 56.3%. That’s almost a 40% increase since the year 2016.
On top of that, 87.5% of marketers state that they were using visuals in more than 50% of the articles they published.
Needless to say, the frequency at which marketers are taking advantage of visual content is trending up.

2. What type of visual content was used more frequently in 2018?
We also asked marketers again what types of visuals they created most frequently in 2018. They were surveyed on the following types of visuals:
- Memes and Gifs: Defined as humorous visuals with some means of pop-culture reference.
- Charts and Data Visualizations: Specifically the visualization of raw data only, or complex data sets.
- Videos and Presentations: Either webinars, animated videos or recorded videos embedded within their content.
- Infographics: A combination of data and graphic design elements, including visual formats like posters, flyers or banners.
- Stock Photos: High-resolution photographs from directories not limited to Unsplash and Shutterstock.
In 2018, 40.2% of marketers stated that they used stock photos the most in their content. This was followed by 36.6% of marketers who said they preferred using original graphics, such as infographics more frequently in their content marketing.
Other visual formats like charts and data visualizations were used frequently by 12.5% marketers, videos and presentations used most frequently by 7.1% of marketers, and gifs and memes were used most frequently by only 3.6% of marketers.

Enhance your visuals and choose from thousands of high-quality stock photos in Venngage’s Image library.
3. What types of visual content engaged audiences best in 2018?
Of course, what matters most is how visual content is performing. Despite using stock photos the majority of the time, 40.2% of marketers who were surveyed said that the visuals which performed best were actually original graphics such as infographics and illustrations.

This was followed by 23.2% who said that videos and presentations performed best, 19.6% who admitted that charts and data visualizations lead to higher engagement and with only 12.5% of marketers stating that stock photos engaged audiences best. Memes and Gifs seemed to have the lowest engagement with 4.5% of marketers stating they saw an impact here.
We found that on average, articles which contained a higher ratio of visuals performed substantially better. Of course we can’t say for sure until we test out this hypothesis a bit more, but we can assume that the more frequent use of visuals and not just the format, also has an impact on engagement. Understanding these content statistics can also help you build brand awareness, by creating unique visual content.
4. How much time did marketers spend on average creating visual content in 2018?
When asked how long they spent on average, producing visual content, 71.4% of marketers stated that they typically spent anywhere less than 5 hours making visuals. This is almost identical to the data we collected during our 2016 survey, where 71.1% of marketers stated they spent less than 5 hours creating visual content.
However, 9% of marketers claimed to spend over 15 hours a week producing visual content compared to 11.4% in the 2016 survey. Overall, it seems like marketers are making better use of their time when it comes to visual content creation as a whole.

5. How did marketers create their visual content in 2018?
We also asked how marketers went about producing their visual content in 2018. In 2016, 32% claimed to use an online tool like Venngage. That number has increased substantially and this year, 49.1% have admitted to using an online graphic software.
This is almost a 60% increase in the past few years. That means that far fewer marketers are relying on freelancers and in-house graphic designers for their visual needs.
In fact, only 9.8% of marketers stated that they used a freelance or contract designer for their marketing visuals, which is roughly a 150% drop from 2016 when 24.1% of marketers mentioned using contracted designers.

6. What was the biggest struggle when it came to producing engaging visual content?
When asked what their biggest struggles were when it came to producing engaging visuals, 34.8% of marketers said it was being able to produce it consistently. This is a small drop from 2016 when 36.7% of marketers were struggling with consistent production of engaging visual content.
Following this, 31.3% said they struggled with creating great designs, 19.6% struggled with sourcing good data or content for their designs, and 14.3% said they struggled with getting a wide enough reach with their visuals.
Comparatively, it seems that marketers are definitely getting a much more impactful reach from their visuals since in the 2016 survey, 24.1% said they struggled with reaching a wider audience. But it also seems that more marketers are now struggling to figure out which content or data to include in their visuals, as only 10.1% were facing difficulty with this in 2016.

7. What percentage of their marketing budget was spent on producing visual content?
In 2018, 42% of marketers said they spent less than 10% of their marketing budgets on producing visual content compared to 31.6% from the year 2016. What’s interesting here is that marketers also stated a higher frequency in their visual content output.
What this suggests is that marketers are continuing to find cheaper alternatives to producing quality branded visual content.
You can now apply your branding directly to your Venngage designs in one click!

More interesting is that 16.9% of marketers claimed to spend more than 30% of their marketing budgets on visual content creation, a drop of almost 50% from 2016, when 25% of marketers stated spending over 30% of their budgets on visual content.
8. How much do marketers project to spend on producing visual content in 2019?
We also asked how much marketers projected to spend on creating visuals in 2019. 32.1% projected to spend more than 30% of their budgets. This was a similar prediction to the previous survey we did in 2016, but it appears that it did not hold true, since the amount being spent seems to be on a decline.

That being said, 29.5% of marketers predict to spend less than 10% of their budgets on visual content creation.
It makes sense that more marketers are spending less money on visual creation considering the adoption of online graphics tools has greatly increased, and the overall cost for a tool compared to a freelancer or an in-house designer is substantially lower.

9. How difficult is it for marketers to consistently product visuals for their brands?
We also asked marketers to indicate on a scale of 1 to 10 how difficult it was to consistently produce branded visuals and 47.4% of marketers voted 7 or higher. 32.1% said somewhere between 4 and 6, and 20.6% gave a rating of 3 or less.
Needless to say, on of the biggest struggles for marketers in 2018 was to consistently produce branded visuals that looked good. At Venngage, we took this feedback to heart. The feature My Brand Kit enables you to apply your brand colors and logos directly to any design you create with Venngage.

Rather than having to manually produce unique branded content for every campaign, you can generate custom designs in one click.
10. What part of creating visual content do marketers wish could be automated?
We also wanted to ask marketers what part of the visual creation process they wish could be automated, and 42.2% hoped that they could generated multiple unique designs based on the content or data they input.
Following that, 28.7% wished they could automatically resize the visuals they created for various social media platforms, and 16.1% wished they could automatically apply their branding to their visuals.
In an effort to make this dream a reality for our audience, we began working on an advanced design automation platform that not only generates multiple unique designs based on your data, but also automatically resizes those visuals for various platforms AND applies your branding directly to the visuals you create.
If you’d like to get early access when this tool is launched, sign up here:
As we move into the next couple of years, it’s clear that there is more of a demand from marketers for the ability to automate their visual content design.
11. How essential was visual content to B2B and B2C marketing strategies in 2018?
When asked how important visual content was to their content marketing strategy, 68.7% of marketers said visual content was either very important or absolutely necessary. Others, that being 21.4% said it was quite important to their marketing strategies, 9.8% said visuals were somewhat important and not surprisingly, nobody said that visual content was not at all important or relevant for their marketing in 2018.

12. What percentage of marketers rely on blogging as part of their strategy?
Since visual content has multi-channel benefits, we wanted to learn more about how people were creating visuals as a way to enhance their blogging efforts. Of the marketers we surveyed, 87.5% said they blogged frequently and that it was in fact an important part of their marketing strategies. The other 12.5% said that they didn’t blog as part of their marketing strategy.

13. What percentage of those blog posts contained some type of visual content?
Of those who said they did blog as part of their marketing efforts, 85.7% said that more than 80% of their blog posts contained some type of visual. 9.2% said that between 50% and 80% of their blog posts contained at least one visual, and the remaining 8.1% said that less than 50% of their blog posts contained visuals.
As mentioned earlier, we’ve seen better performance from articles we’ve produced that contain a higher visual to text ratio. These articles tend to rank higher on SERPs and also lead to better direct conversion rates.

14. What percentage of businesses will rely heavily on visual content for marketing in 2019 and 2020, according to marketers?
Lastly, we asked marketers to tell us what percentage of businesses they thought would rely heavily on visual content in 2019 and 2020, and 45.5% predict that more than 80% of businesses would rely heavily on visuals as part of their content marketing efforts.
Following that was 42% of marketers who foresee between 50% and 80% of businesses relying strongly on visual content. And the remaining 12.5% believe that less than 50% of businesses would heavily rely on visual content.
It appears that for the most part many marketers consider visual content to be an integral part of the growth initiatives, and believe that more and more businesses will adopt visual communication in the coming years.
Visual content is the way of the future
The data says it all—visual content isn’t going anywhere any time soon. Not only are more brands leveraging the use for of visuals for various social media platforms, but there is a lot of added benefit when it comes to SEO and organic rankings as well, particularly in Google’s image search results.
And of course, creating engaging visual content is a surefire way to resonate with your audience and communicate your ideas more effectively.
10 Visual Content Marketing Statistics to Know for 2017

1. What percentage of content published contained visuals?
When asked, 77% of marketers stated that 71% to 100% of the content they published in 2015 contained visuals. Of that 77%, 40.5% of marketers stated that 91% to 100% of the content they published in 2015 contained visuals.
But when asked about their use of visuals in their content strategy during the year 2016, 83.5% of marketers stated that 71% to 100% of their content contained visuals, and 53% of marketers said that 91% to 100% of their content contained visuals.
In 2016, less than 10% of marketers surveyed used visuals under 50% of the time.
From 2015 to 2016, the use of visual content in articles published by marketers increased by an incredible 130%.
2. What kind of visuals were most frequently produced?
When asked what types of visuals were most frequently produced during the year 2016, 35% of marketers stated that they used stock photos the most, while 30.4% of marketers stated that they used original graphics, such as infographics and illustrations, most frequently.
The other forms of visual content that were most frequently produced were videos and Presentations (such as SlideShare presentations), which were used 15.2% of the time, charts and data visualizations, which were used 14% of the time, and GIFs and memes, which were used only 5.4% of the time.
3. Which visuals performed best?
Marketers were also asked to share which kinds of visuals performed best in 2016. Shockingly, just 7.6% of marketers stated that stock photos had the most impact, despite being the most frequently used type of visual. Meanwhile, 41.5% of marketers said that original graphics, such as infographics and illustrations, performed best.
Other high performing kinds of visuals were charts and data visualizations, which 25.7% of marketers claimed lead to the highest engagement. In addition, 20.2% also mentioned that videos and presentations performed best, and only 5% of marketers said that GIFs and memes performed best.
4. How much time was spent a week on making visuals?
When asked to share how much time was spent a week producing visual content, 71.1% of marketers claimed that they spent less than five hours a week making visuals.
Contrary to that, 11.4% of marketers claimed that they worked more than 15 hours a week on producing engaging visuals for their content strategy, and 17.5% stated that they worked between five and 15 hours a week on visuals.
A tool like Venngage takes the heavy lifting out of infographic creation by offering professionally designed templates that could save marketers hours.
5. What methods were used for creating visuals?
When asked how marketers created their visual content, 32%–the vast majority–claimed to use an online graphic design tool like Venngage. Following that number, 30.4% said they used an in-house designer.
Marketers who used a freelance designer made up 24.1%, and 14.5% stated that they used other means for creating and curating visuals such as Instagram, Flickr and Photoshop.
6. What was the biggest struggle when creating engaging visuals?
Next, marketers were asked to share their biggest struggle when it came to creating engaging visuals in 2016. The leading statistic was that 36.7% of marketers struggled with being able to produce visuals on a consistent basis. In second place, 29.1% of marketers struggled with producing well-designed visuals, and 24.1% said they struggled to reach a wider audience with their visuals.
Only 10.1% of marketers said their struggled to source reliable and interesting data.
7. How integral is visual content to marketing strategies in 2017?
Marketers were asked to express how integral the use of visual content would be to their marketing strategies in 2017.
Most marketers, 60.8%, stated that the use of visual content was absolutely necessary to their marketing strategy. Following that, 31.7% said that visual content was very important for their marketing strategies in 2017, while 5% said it was just important, and 1.3% claimed that visual content was only somewhat important. Only 1.3% claimed that visual content was not important at all to their marketing strategy.
8. What percentage of marketing budgets were spent on visual content in 2016?
When asked what percentage of their budget was used on visual content in 2016, 31.6% of marketers surveyed said that 0% to 10% of their budget was spent on visual content, and 25.3% of marketers said that 11% to 20% of their budget was spent on visual content.
Only 1.3% of marketers claimed that they spent 91% to 100% of their budget on producing visuals for their marketing strategy.
9. How much do marketers project to spend on visual content in 2017?
Finally, when asked what they projected to spend on visual content in 2017, 21.5% of marketers stated they planned to spend 0% to 10% of their budget. Another 21.5% planned to spend 11-20% of their budget on visual content, yet another 21.5% of marketers surveyed predicted spending 21-30% of their budget on visual content.
The remaining 35.5% of marketers predicted they would spend over 31% of their marketing budgets on visual content.
Final thoughts:
Based on the results of this survey, it’s obvious that the majority of marketers understand the incredible value of using visuals in their 2017 marketing strategies In particular, they understand the value of using infographics, charts and data visualizations.
The truth is that when there is so much text-based content produced on a daily basis, and even on an hourly basis, you need to test out other forms of content (in conjunction with a solid SEO strategy and reliable SEO checker) to captivate your audience.
Make 2017 the year that people remember your brand and get a head start on creating awesome visuals that people will love.
The 7 Biggest Graphic Design Trends That Will Dominate 2021 [Infographic]
