


Infographic templates can be a total life-saver.
They make it possible to create amazing infographics quickly and easily, without hiring a professional designer.
But when you’re designing from a template, you might worry your infographic will end up looking like every other infographic out there.
I’m here to tell you that with the right techniques, it’s possible to transform any infographic template into a design that’s totally on trend and true to your personal style.
So without further ado, check out these top 7 tips for customizing your infographic templates to give them a unique, personal touch:
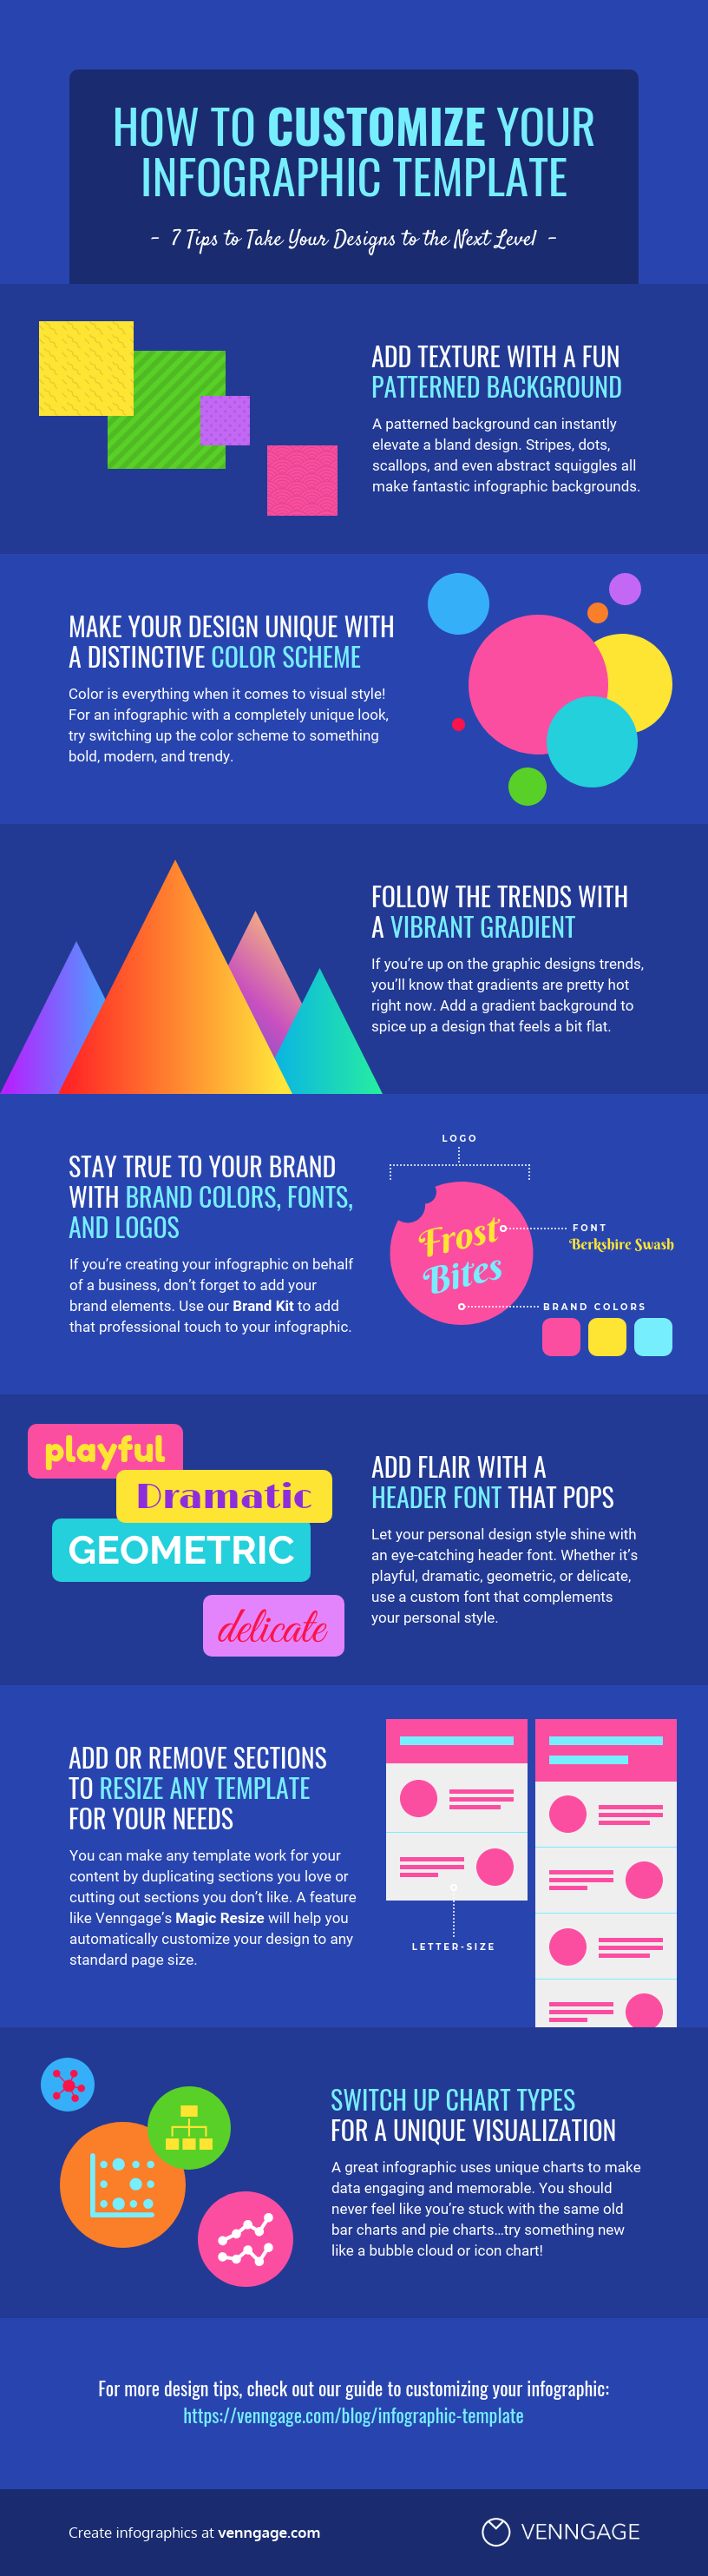
- Add texture with a fun patterned background
- Make your design unique with a distinctive color scheme
- Follow the trends with a vibrant gradient
- Stay true to your brand with brand colors, fonts and logos
- Add flair with a header font that pops
- Add or remove sections to resize any template for your needs
- Switch up chart types for a unique visualization
With these tips, transforming a template to reflect your brand, your taste and your content is a breeze. Let’s have a closer look at each one.
1. Add texture to the infographic template with a fun patterned background
A patterned background can bring a lot to the design of an infographic. By adding depth, texture and character, a patterned background really sets the tone of a design.
Basic patterns like stripes often help an infographic feel more complete and refined, while playful patterns like dots, scallops and squiggles can make a design feel more approachable, natural and organic (like in the example below).
Personally, I love to use patterned backgrounds to elevate bland, boring designs — to add visual interest when an infographic feels a bit bare. Even a very simple background pattern, like the one in the infographic below, can add a lot to the overall style and feel of an infographic.
We’ve got a selection of background patterns in Venngage to help you add some extra style to your infographic templates.
You can find them under the Background section in the Venngage Editor — just click to apply to your design!
2. Make your infographic design unique with a distinctive color scheme
Color is a huge component of visual style, and a distinctive color scheme will go a long way towards changing the look and feel of your infographic template.
Just check out these color-forward posters for the Global Fund for Change. The bright, colorful palettes completely dominate the designs, defining the style of the poster and making them thoroughly eye-catching.
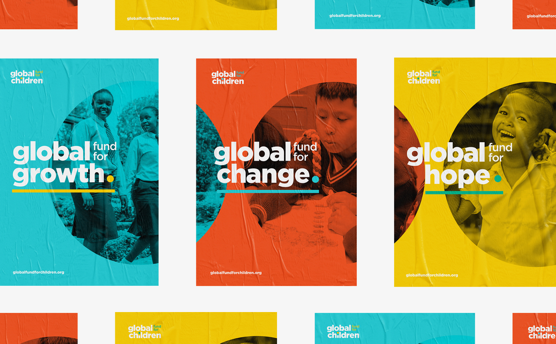
To create an infographic with a completely unique look, try switching up the color scheme to something bold, modern and trendy. A new color scheme is the easiest way to add your own personal touch to a pre-designed template.
Related: 7 Tips on How to Make a Great Infographic
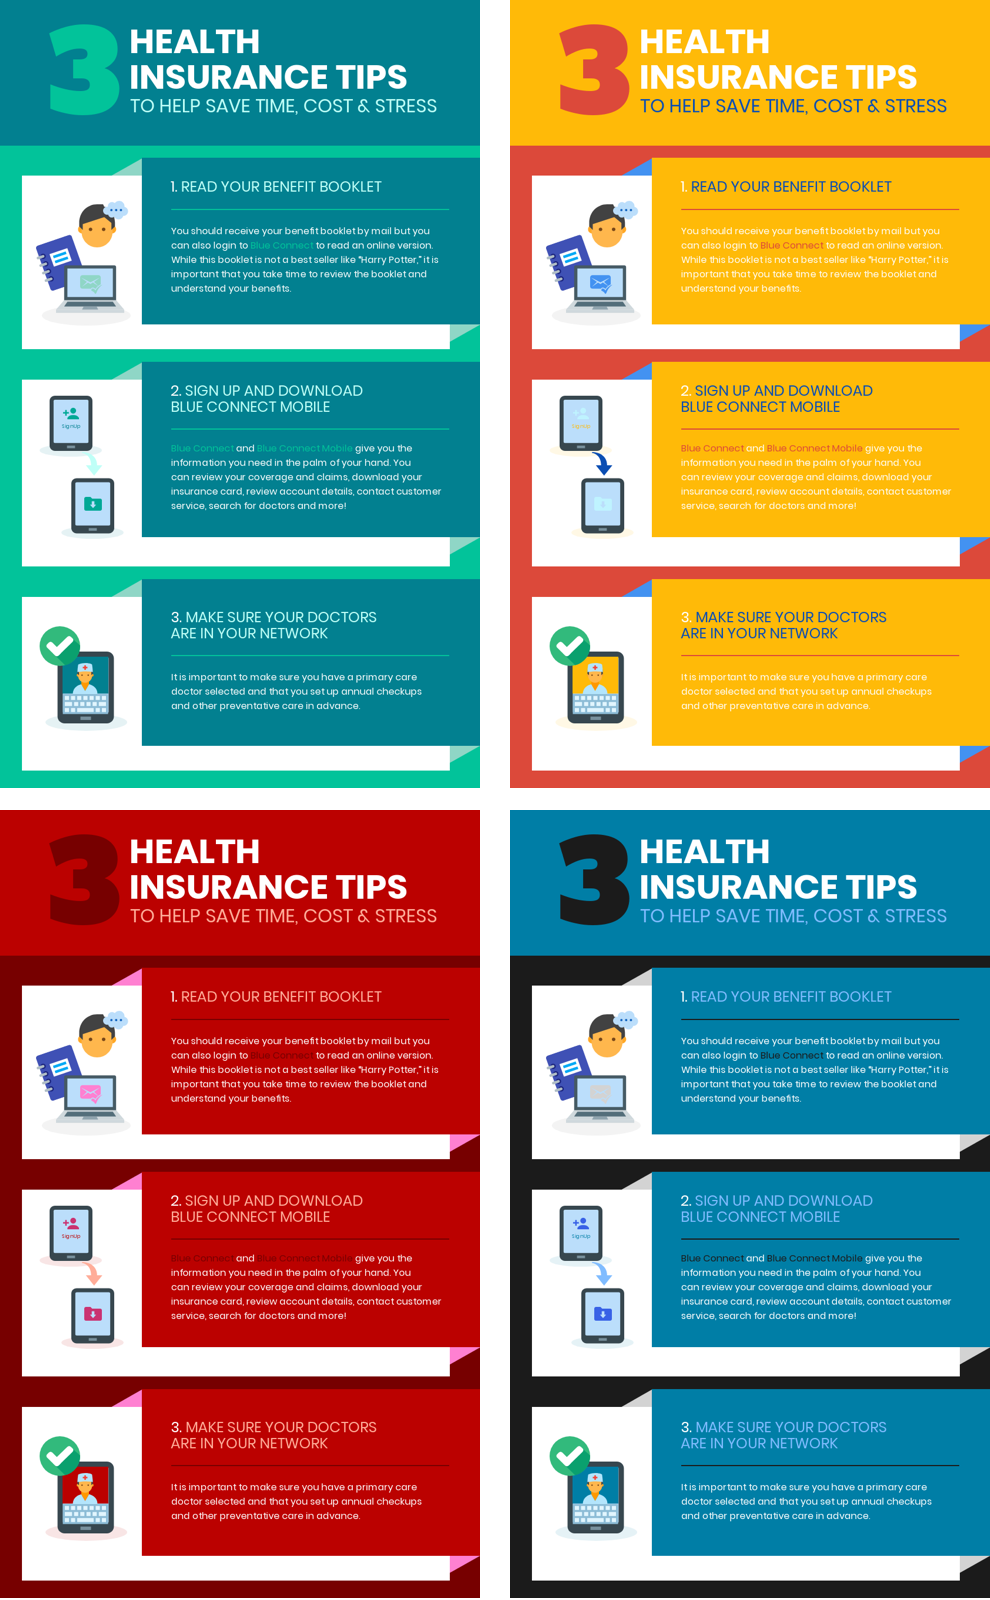
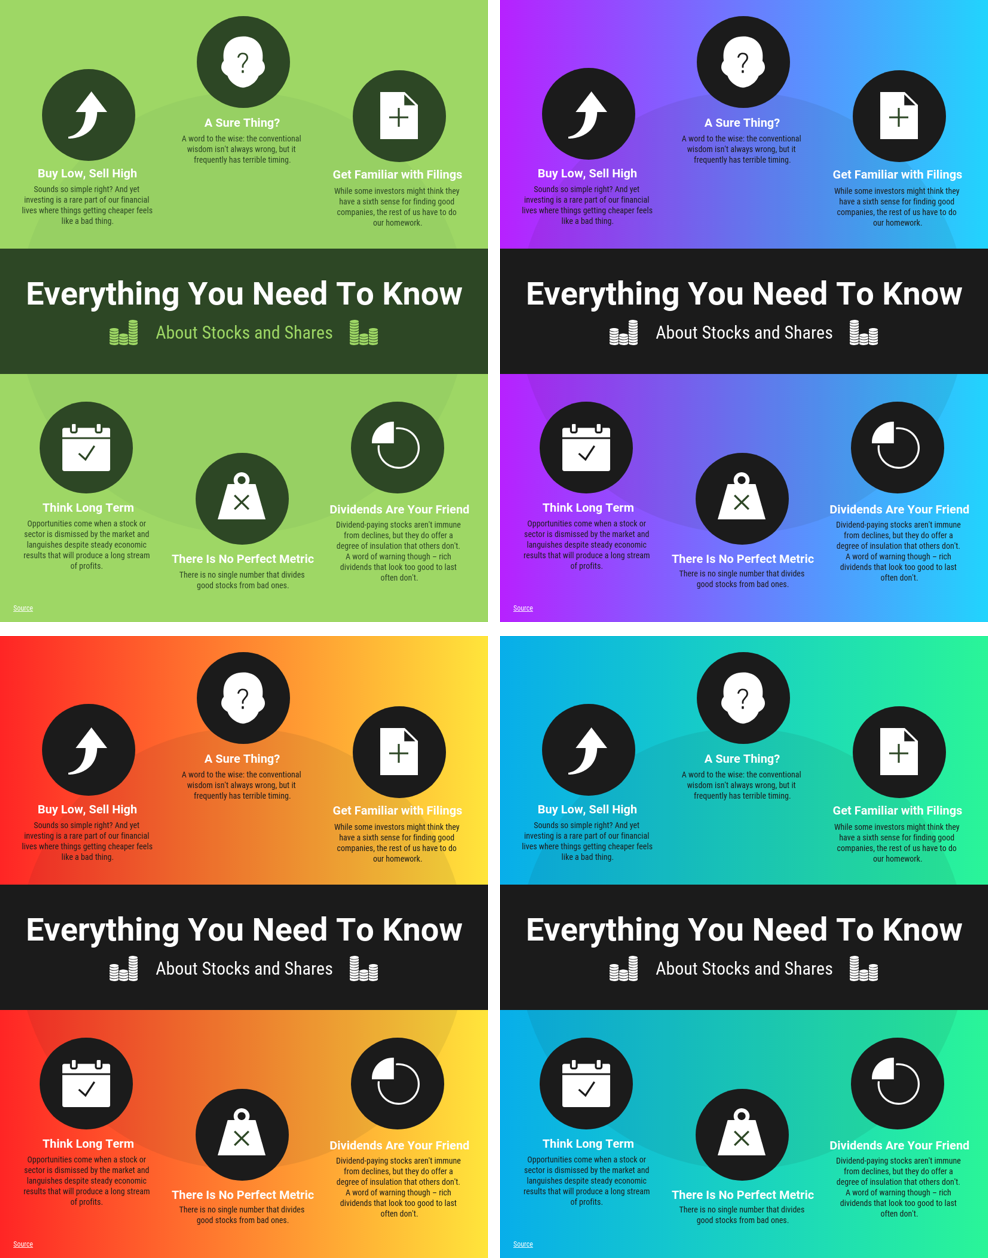
Check out how much each color palette impacts the tone of the template below:
To switch up the color schemes in your infographic, you could go through the template and change the color of each element one at a time.
But who has time for all that!?
With our new and improved Brand Kit, you can try out color schemes with a single click! (Note, my Brand Kit is available for Business and Enterprise plans.)
Just pick one of our curated color schemes under My Brand Kit and click to apply it to your design. If you don’t like the way it looks, simply click again to shuffle — you’ll get a slightly different version of the same color scheme.
Don’t like the default colors in the Brand Kit or need some more inspiration?
- Check out Design Seeds to get color schemes inspired by Instagram-worthy images
- Get popular color schemes made by professional designers at ColorHunt
- Choose a color palette based on your preferred design style
Or use my favorite trick: steal a color scheme from another infographic template!
3. Follow the trends: add a vibrant gradient to your infographic template
If you’re up on this year’s graphic design trends, you’ll know that gradients are pretty hot right now.
Equally popular in web design and graphic design, vibrant gradients seem to be popping up left, right and center in tons of posters, flyers, advertisements, website landing pages and mobile apps.
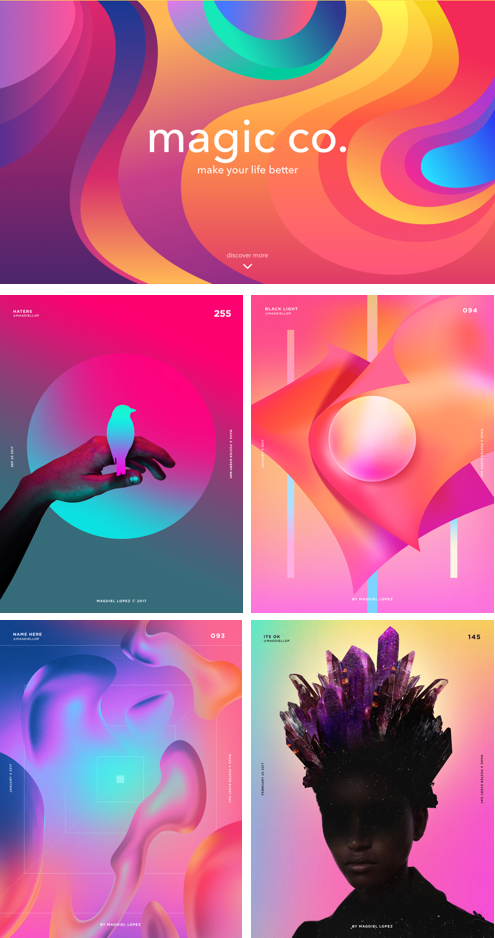
Sources: Tubik Studio, Magdiel Lopez
The trends in infographic design are no exception — gradients are simply appearing everywhere! Probably because they can add depth to designs that feel flat, and can spice up designs that lack that “wow” factor.
To help you keep up with this trend, we’ve added a few gradient options in Venngage (with more to come soon). You can find them under Backgrounds in the left panel.
4. Create an infographic that’s true to your brand with brand colors, fonts and logos
Visual consistency is incredibly important for brand recognition and brand visibility. If you’re repeatedly producing visuals to promote or represent a business, you should be designing with your brand in mind.
You can customize your infographic template with your brand elements in three simple steps:
- Replace the template’s dominant color with your core brand color
- Add your logo to the infographic header or footer (if you don’t have a logo yet, try our logo maker)
- Use your brand font as the title font

If you don’t want to make all of these changes manually, get your hands on your company’s brand style guide and add your brand elements to your Brand Kit in Venngage.
Once you’ve added your brand fonts, colors and logos to your Brand Kit, you can apply your brand to any template with just a few clicks.

5. Add flair to your infographic with a header font that pops
Creative typography has become another big trend in graphic design lately, and adding a bold, decorative header font is the perfect way to take your infographic to the next level.
Not only will this draw readers’ attention to your infographic, it will allow you to inject some of your personal style into the design. A strong header will also help reinforce the visual hierarchy of the design, giving your infographic a clear, structured flow.
Many infographic templates (like the one below) are designed with sans-serif header fonts. These fit well into clean, modern design style that’s popular these days, but may lack in personality.

For a more eye-catching effect that showcases your personal design style, switch the header font up to something more stylized. Whether it’s playful, dramatic, geometric or delicate, find a custom font that complements your personal style.
Besides helping your header stand out from the rest of the text, this can help your infographic stand out from the crowd.
In the example below, it’s easy to see the massive difference a unique header font makes in the overall impact of an infographic design. You don’t even need to change up all the fonts in the template — even just changing the header font makes a huge difference!

That said, you don’t want to have too many type styles or typefaces in one design.
If you add a strong, stylized header, it’s a good idea want to pair that with more minimal sans-serif fonts for the subheader and body text. Fonts like Roboto, Source Sans Pro and Verdana make perfect pairings for stylized headers.
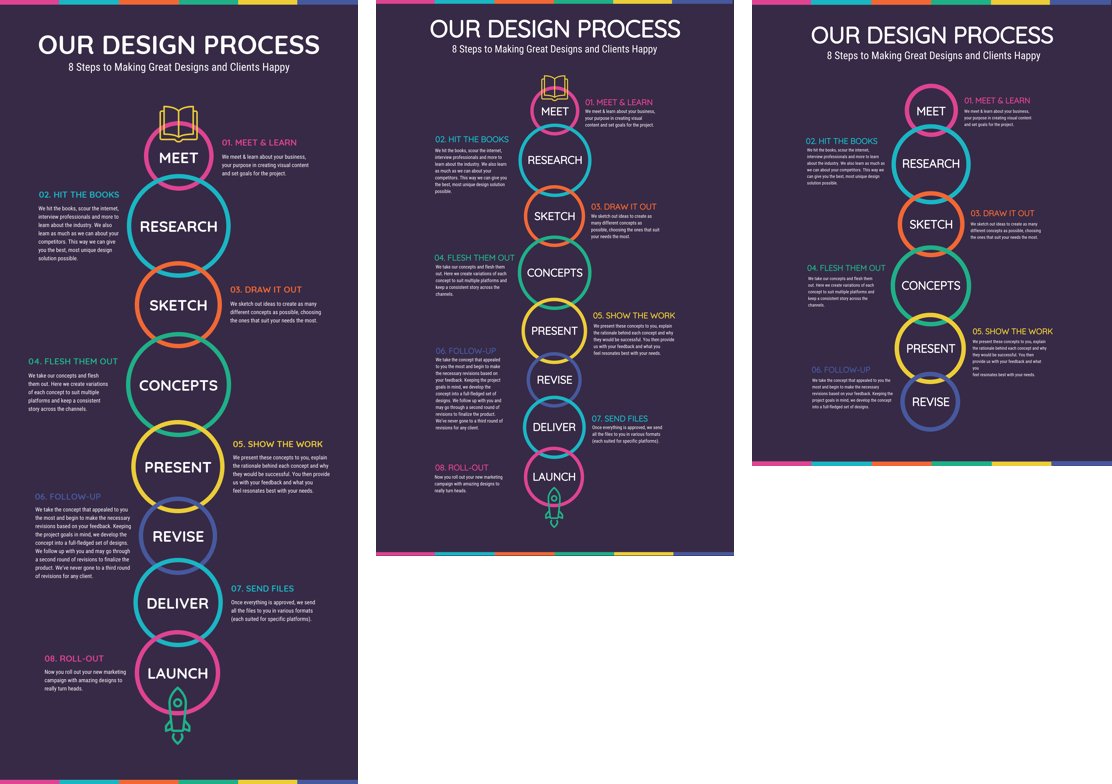
6. Add or remove sections to resize any infographic template for your needs
A lot of the time, the template you like isn’t going to be exactly the right size for your content.
Sometimes, you’ll love a template that’s much too small for your content. Other times, you’ll love the style of a long scrolling template, but you’ll need to print it on letter size paper.
That doesn’t mean you can’t use those templates. It just means you have to play with the template a bit to make it work perfectly for your content.
You can make almost any template work for your content by duplicating sections you love or cutting out sections you don’t like, then resizing the page to fit the required specs.
This is where Venngage’s multi-select function comes in handy.
You can click and drag to select multiple infographic elements at once, which makes it easy to add, delete and move entire sections of a template at once.
You can even copy and paste elements from one template to another. So if you see something you love in one template, but you want to use a different template, you really can have the best of both worlds!
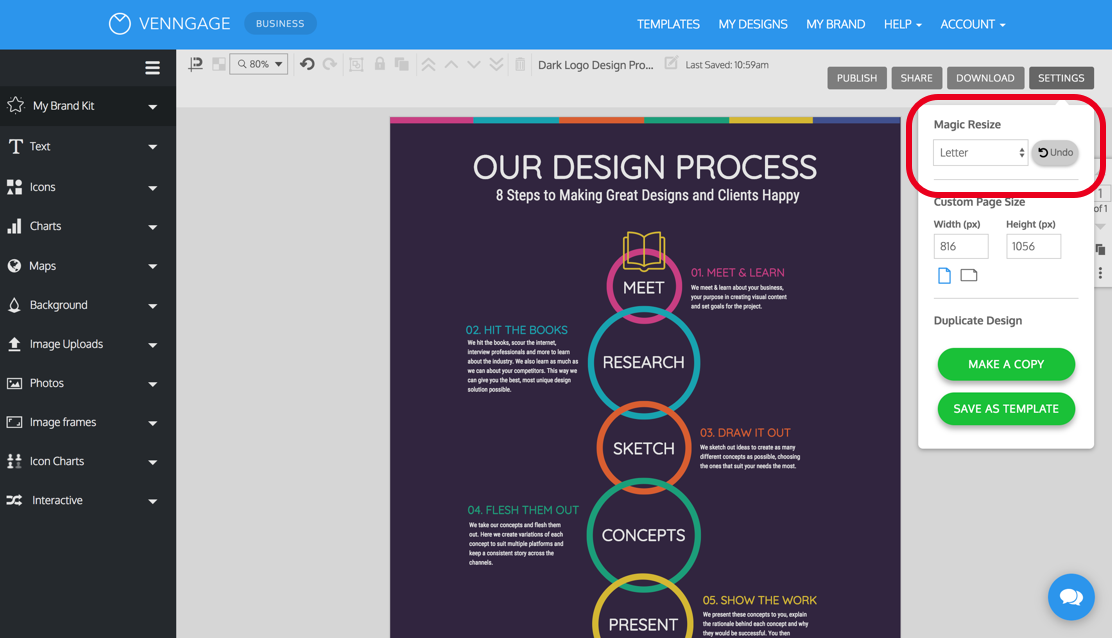
Once you’ve added or removed the sections you need and don’t need, Venngage’s Page Resize will help you automatically customize your design to any standard page size.
Head to Settings and choose the page size you’d like under Page Resize and check scale content on resize. We do the heavy lifting for you, resizing the whole design to fit the new page size.
Once you get used to changing the page size and adding and removing sections, you can make pretty much any template work for your content.
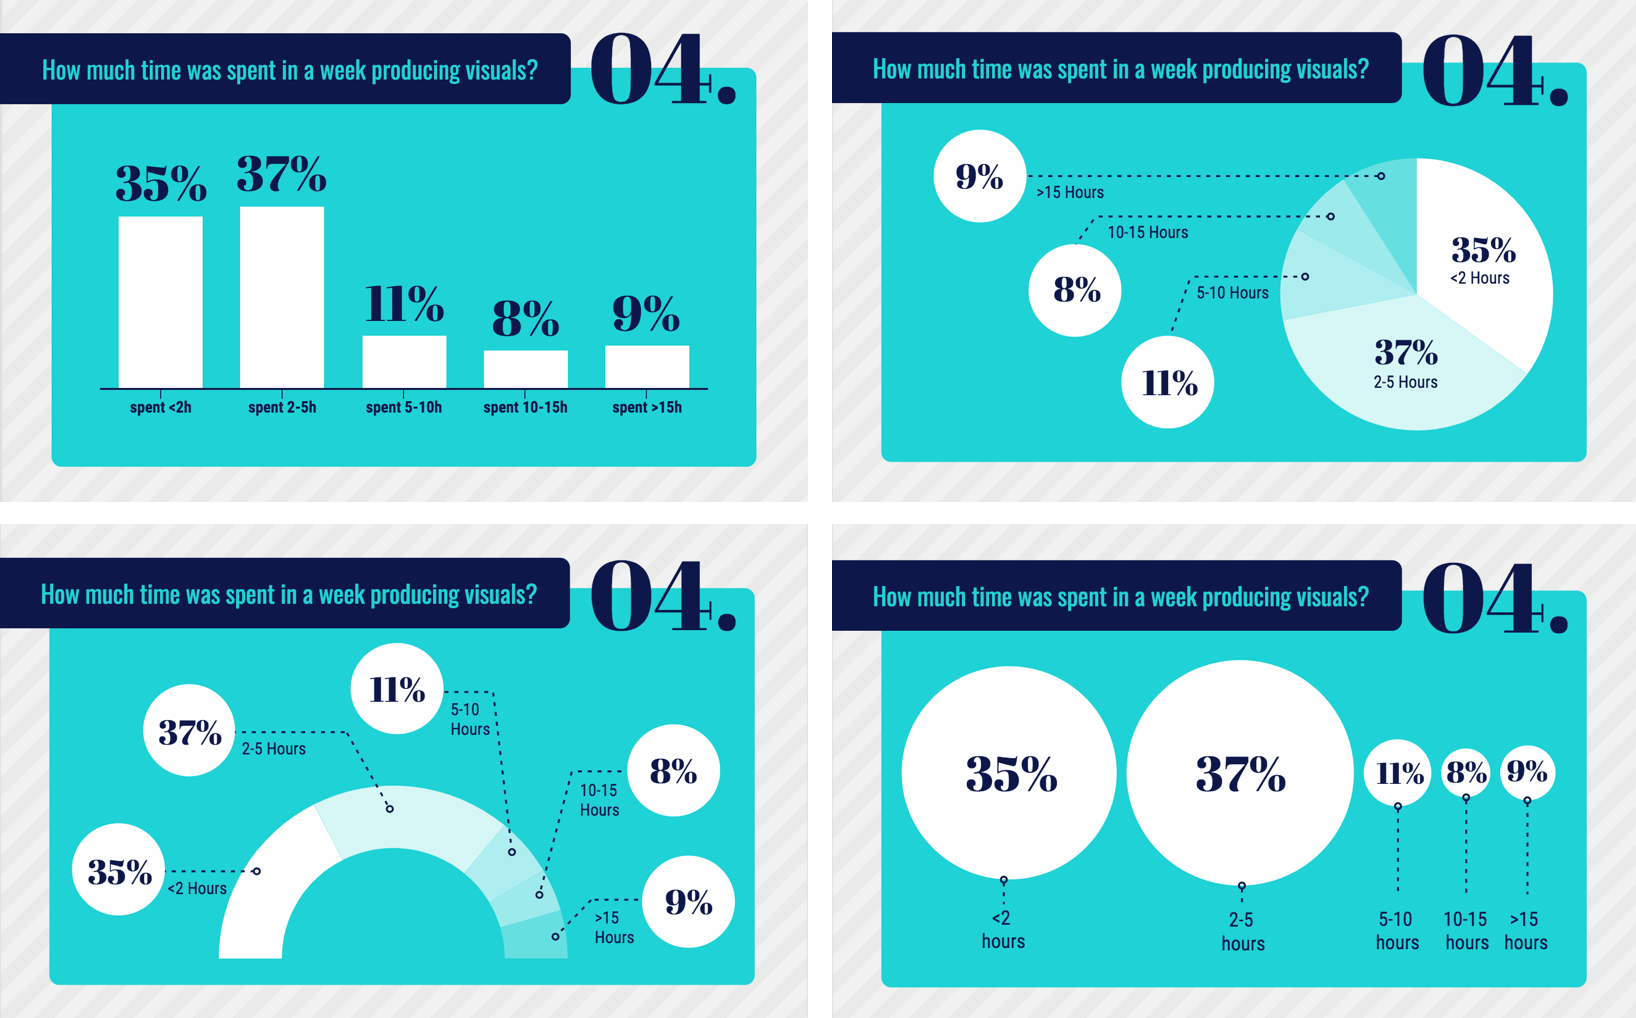
7. Switch up chart types for a unique visualization
A great infographic uses unique charts to make data engaging and memorable.
Infographic designers will either dress up traditional charts like bar and pie charts with fancy labels or use unconventional charts like word clouds or icon charts to grab their readers’ attention.
That’s because the success of a statistical infographic (like the visual content marketing infographic below) hinges on the visual presentation of the data. Each set of data must be shown with the right chart type for the data, all the while being visually interesting and engaging.

So to make your infographic unique and visually engaging, try to branch out a little. Vary the types of data visualizations you use based on the type of information you’re trying to communicate.
Use visuals to enhance your audience’s understanding of the data, too.
Don’t be afraid to try something new like a bubble cloud, donut chart or icon chart! At the very least, add some stylized data labels to draw attention to important data points.
Venngage’s Chart Type function makes it easy to give your infographic that data visualization edge. Once you’ve added your data, you can swap chart types with just one click!

Customize any infographic template to your hearts content
Just because you’re using an infographic template doesn’t mean you have no creative freedom. These seven tips can help you elevate your infographic template to give it that unique, personal touch:
- Add texture with a fun patterned background
- Make your design unique with a distinctive color scheme
- Follow the trends with a vibrant gradient
- Stay true to your brand with brand colors, fonts, and logos
- Add flair with a header font that pops
- Add or remove sections to resize any template for your needs
- Switch up chart types for a unique visualization
Try them out with your next infographic, and you’ll soon be making custom designs like a pro!